Thursday, October 22, 2020
23andMe: Worse and Worse
Thursday, October 8, 2020
Giving Birth on the Atlantic Ocean
- Liner Transatlantic Crossing Times, 1833 – 1952 (in days), The Geography of Transport Systems
- A Walloon family in America; Lockwood de Forest and his forbears 1500-1848 Vol 1, Westward Again, Pages 75-80.
- Birth of Australia Dominica Scioli, 28 Feb 1880, Register of births at sea of British nationals, 1875-1891, FHL Film Number 1483321, Page 78
- Death of Australia Domenica Scioli, 02 Mar 1880, Register of deaths at sea of British nationals, 1875-1888, FHL Film Number 1483315, Page 92.
- New-York tribune. (New York [N.Y.]) 1866-1924, March 11, 1880, Page 8, Image 8. Library of Congress, Washington, DC.
Wednesday, September 16, 2020
Why All the Scotland?
For once, Ancestry actually honestly addressed this by explaining that natives to the British Isles have a lot of genetic overlap and can be difficult to tell apart, highlighting the fact that this is still just an estimate or interpretation of our DNA, and it should not be taken too literally.
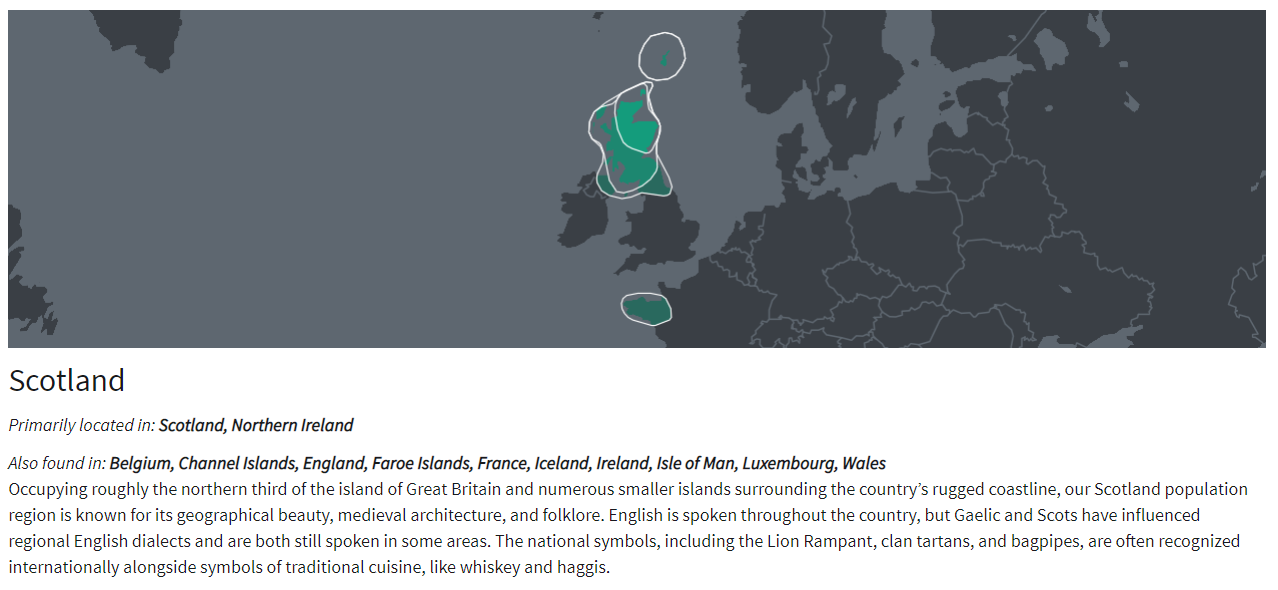
But Scotland also has a lot of genetic overlap with mainland Europe, and I wanted to share some data and visuals that help illustrate all this. Firstly, although they haven't added the link for it yet, if you pull up the "full history" of the Scotland category (add "/ethnicity/Scotland/history" to the URL after the long that ID number), you'll see it lists all the surrounding areas included in "Scotland" (screenshot above):
Primarily located in: Scotland, Northern Ireland
Also found in: Belgium, Channel Islands, England, Faroe Islands, France, Iceland, Ireland, Isle of Man, Luxembourg, Wales
That's a big area this category is covering and makes the title of solely "Scotland" seem a little misleading. So is the map, which, apart from Brittany, half of Northern Ireland, and a sliver of Northern England, isn't covering any of the other locations listed here. Brittany, the seemingly rogue area in France that is included in the Scotland map, might seem out of place, but it actually makes a lot of sense. Brittany, as the name suggests, is actually heavily Celtic. In the 5th century, Celtic Britons fled the Anglo-Saxon invasion of Britain and went to what is now Brittany, France. In fact, people there still speak a Celtic language called Breton that bares a similarity to Scottish Gaelic. But Scotland and France were often allies throughout history (united by their shared enemy, the English), so it wouldn't be unusual to see genetic similarities to other parts of France too.
And there's more.
I reference the PCA chart in the ethnicity white paper a lot, and there's a reason for that. It shows us upfront just how much genetic overlap there is among different regions. The latest PCA chart (shown right) is the most detailed yet, including a break down of countries that are lumped into bigger regions in our results.
It can be a little difficult to tell some of the icons apart, so I actually overlaid some colored blobs to show the overlapping regions. Even that can be difficult to tell apart because the overlap is so significant for the British Isles alone. This is why the rest of the British Isles is included in the "also found in" details.
The light blue blob is Ireland, dark blue is Scotland, red is Wales, and dark grey is England. Scotland, Wales, and England in particular are almost indistinguishable, and Ireland still have significant overlap with them. So it's hardly surprising if your break down of the British Isles isn't exactly what you'd expect.
And Scotland has some noteworthy overlap with a lot of mainland Europe too, not all of which are included in the "also found in" details. According to the PCA chart, European countries that have overlap with Scotland include Germany, France, Denmark, Netherlands, Norway, and even Sweden.
It's difficult to even see which countries are included because there's so much overlap.
So basically, if you have ancestry from any of these regions, including the ones in the "also found in" details or the ones in the PCA chart, it could theoretically be turning up in your Scotland results. So the final inclusive list should be more like:
Northern Ireland
England
Wales
Ireland
Netherlands
Denmark
Norway
Germany
Luxembourg
France
Belgium
Channel Islands
Faroe Islands
Iceland
Isle of Man
Sweden
That's all of the British Isles, and the majority of Scandinavia and Northwest Europe.
Granted, AncestryDNA's algorithm may have been able to weed out the likelihood of some of those areas showing up under Scotland (I know they remove PCA outliers), and perhaps that's why not all of these areas are listed in the full details, but that's not necessarily foolproof, so I would still keep in mind that all of these places have some genetic overlap with Scottish samples.
The PCA chart is very enlightening and anytime you have a question about DNA ethnicity and unexpected results, this chart might be able to answer it. AncestryDNA aren't always very forthcoming about the fact that Europe is so genetically mixed and neighboring regions often share too much DNA to accurately tell them apart, but the PCA chart doesn't lie (though you can generally exclude extreme outliers). I just wish they'd release ones for other parts of the world too, and some for areas where continents mix. For example, I'd love to be able to see how much genetic overlap Southern Italy might have with the Middle East and Northern Africa. I'd also like to see what populations Ashkenazi Jews most closely match (at one point, they were on the European PCA chart, but due to the fact that they were so dissimilar to any other group in Europe, they were obviously removed - I'd love to see if perhaps they are more closely related to Middle Eastern samples than European ones). And of course, not everyone is white and it'd be great if AncestryDNA provided as much background data about other parts of the world as they do with Europe. Providing PCA charts for them would be a great start.
Additionally, AncestryDNA used to have a chart that showed the average admixture for their samples (for people native to each region). For example, it showed us that the average person from the region which was "Italy/Greece" could expect to get about 10% results in the Middle East or Caucasus. It was highly informative in illustrating how genetically mixed some areas are (and also how distinct other populations can be). I have begged AncestryDNA support multiple times to make this data available again, but they refuse. I think they don't want to "confuse" customers too much, but in my experience, the less information you give people, the more confused they'll be. The constant questions about this I see on social platforms prove it.
Friday, September 11, 2020
AncestryDNA 2020 Ethnicity Update is Here!
My update in comparison to the last one really highlights once again how much genetic overlap there is among the British Isles, Germanic Europe, and Scandinavia. I have ancestry from all three places, and AncestryDNA (and other companies) can never get them right. With each update, it swings from one extreme to another. The last update, for example, had me at 0% Norway even though I had one Norwegian great grandfather. With the latest update, I'm now 15% Norwegian! This is pretty close to the 12.5% the paper trails says I should be, but of course, we do not necessarily inherit exactly 12.5% from each great grandparent, so 15% is totally plausible, apart from the fact that all other reports usually underestimate my Norwegian ancestry (usually under 10%) which has also lead me to suspect that I inherited less than 12.5% from that particular ancestor. I don't know that though, it's just a hunch, so I can't say 15% is "wrong".
Anyway, here's the full breakdown, in comparison to what it was before.
2019 Estimate:
43% Germanic Europe
22% England, Wales & Northwestern Europe
21% France
12% Italy
2% Greece & the Balkans
2020 Estimate:
27% Germanic Europe
18% Scotland
15% Norway
12% England & Northwestern Europe
12% Southern Italy
11% Northern Italy
5% France
My Italian results have been bumped back up to a reasonable amount (if you recall, I had one Italian grandmother), but they are still lower than what I know they should be. As I've talked about before, my paternal grandfather tested so I know I inherited 18% from him, which means I inherited 32% from my paternal Italian grandmother. So I am fortunately enough to know for a fact that I should 32% Italian. The new results breaking down North and South Italy add up to only 23% (though if that 5% France is coming from my Italian ancestry, then it's 28%). Had my grandfather not tested, I would assume 23% is close enough to the expected 25% and been happy with that, but because I know differently, it's a little disappointing. Additionally, my Italian ancestry is supposed to be entirely southern, not northern, but I'm not hugely surprised they weren't able to tell the difference.
Back to Northern Europe. According to my tree, I should be about 23% Germanic, 32% British (English and Scots-Irish), and as mentioned, 12.5% Norwegian. But I am German and British on both sides of my tree, so really, who knows how much I inherited of each? Especially with the new breakdown of the British Isles into four groups - England, Wales, Scotland, and Ireland - I really haven't even tried to determine how much of my English vs Scots-Irish I might have inherited according to my tree. I do have more recent English ancestry (an English ancestor who immigrated in the 1850s, whereas all Scottish or Scots-Irish immigrated in colonial times), so all I can say for sure is that I can reasonably expect my English results to be higher than Scottish, which they are not. However, combined, they do add up to 30%, which is very close to my estimate according to my tree, and I correctly don't have any results in Wales or Ireland. Of course, this leaves me with 27% Germanic, which is again pretty close to my estimate based on my tree.
So, overall, this new DNA estimate is pretty accurate, if we look at it from a broader view by lumping North and South Italy back together, and England and Scotland back together. If they hadn't tried to split those regions up and just changed my percentages, it would really be spot on.
I can't say the same for my dad's report (right).
The last update in 2019 had my dad at exactly 50% Italian, which was exactly right. My dad's mother was Italian and since we do get exactly 50% from each parent, his ethnicity report should reflect that. A few percentage difference may be within a margin of error, but to get exactly 50% gave me a lot of confidence in the results, so to move away from that 50% even slightly feels like a major downgrade.Dad's 2019 Estimate:
50% Italy
31% England, Wales & Northwestern Europe
7% Ireland & Scotland
7% France
5% Germanic Europe
Dad's 2020 Estimate:
29% Southern Italy
19% England & Northwestern Europe
16% Scotland
15% Northern Italy
7% Turkey & the Caucasus
5% Norway
4% Germanic Europe
3% Greece & Albania
2% Ireland
According to my dad's tree, he should be 50% Italian, and the other half about 30% Germanic, 20% British (mostly Scottish or Scots-Irish), so to see so many more regions in his list than before instantly felt like a regression. His total Italian results are only 44%, and even if you try to add in neighboring regions like Greece and Turkey, he then has 54%. I know that's not far off 50%, but again, when his previous results were exactly 50%, it feels like a downgrade to deviate from that even slightly.
His Germanic results didn't change much at all, which means it's still being massively under reported, but when you consider that it's probably showing up under the "Northwestern Europe" part of England, it's actually pretty accurate. Combining Northwest Europe and Germanic, he gets 22%, which isn't too far off what his tree estimates. And who knows where that 5% Norway is coming from - could be either his Germanic or British ancestry. That leaves the 16% Scotland and 2% Ireland, which is very close to what his tree is for Scottish and Scots-Irish.
So again, combining specific regions does add up to make some sense, but there's also some regressions.Over analyzing all my kits might be getting a little tedious, so I'll summarize the rest. My mom's kit (right) went from a very accurate 27% Norwegian (remember, she had one Norwegian grandparent), to a greatly overestimated 46%. She also got 11% in Wales and 10% in Sweden, neither being places she has ancestry in (and that Swedish results can't be coming from her Norwegian ancestry since that would bump it up to 56%, more than double what should be expected).
My paternal grandfather's results at AncestryDNA have always overestimated his British ancestry and underestimated his German ancestry. He should be about 40% British (Scottish or Scots-Irish), and 60% Germanic, but the results are always flipped, and this time is no different, with only 33% Germanic. Granted, he has 38% in England & Northwest Europe, which could go either way. Then he has 27% in Scotland. So what it's really saying is 38% of his DNA can't be distinguished between British and Germanic, which isn't surprising.
Finally, my husband's results (right). My husband is actually a British native - his father was Irish and his mother was mostly English with one Scottish branch and one Irish branch from further back, so he would be roughly 53% Irish, 41% English, and 6% Scottish. His previous results reflected that almost exactly with 43% England, and 56% Ireland/Scotland. So just like with my dad's Italian results, any deviation from that seems like a regression, and that's what happened here too. His new results have him at 41% Ireland, 33% England, and 25% Scotland. For someone who is pretty close to half English and half Irish, this is way off, but that's hardly surprising, since the PCA chart shows there's really not much distinction among these small, neighboring regions so I don't know why they are even attempting to split them up. At least his Genetic Communities are very accurate.Additionally, the last 2 updates gave my husband 1% noise results in Africa, and for some reason it still remains. I know he's not the only one though, I have seen other reports of people with predominately British ancestry getting 1% in Africa with no known history of it. It's likely just noise, but I wish they'd sort it out already.
So, while I'm pleased that my Italian and Norwegian results accurately went up, the rest of the changes are a bit of a disappointment.
Wednesday, September 9, 2020
AncestryDNA Ethnicity Update in the Works
Recently, AncestryDNA have announced that in coming weeks, they will be rolling out a new ethnicity update with a banner at the top of the DNA homepage. Clicking on the banner takes you to a page that promises new regions and their most precise breakdown yet. It includes a map showing the different coming regions, but we don't get any details beyond the map. It also claims to have over 40,000 samples in their reference panel, and looking at the new white paper shows it's actually over 44,000 which is only a slight increase from the last update which used just over 40,000. With only a minor increase in the samples, that suggests much of the update might be in a change to the algorithm. The FAQ on the announcement page provides a little more info, but it doesn't actually detail what the new breakdowns will be.
Left: European regions before the upcoming 2020 ethnicity update. Right: European regions after the upcoming ethnicity update.
However, we can get a little bit of a preview by looking at our newest DNA matches, who are obviously already receiving the update. If you go to your DNA match list and click "groups" and select "new matches", then look at the ethnicity comparison with them.
From that, you'll be able to see some of the new regions and how they will be broken down. For example, Wales will now be a separate category, no longer lumped in with England/NW Europe, and Ireland and Scotland are now separate categories too.
In southern Europe, Italy will be split up into Northern and Southern Italy (see below). This isn't shown in the before/after map Ancestry's announcement page provides, which is why I say it's not very detailed and I don't think it's giving us the full picture. Additionally, Cyprus will be getting it's own category, no longer a part of Turkey/Caucasus or the Middle East.
It doesn't look like there's much, if any, changes to Africa, Native America, or Asia, but that's because the before/after map on the announcement page isn't reliable. The "before" map seems to actually be using the regions from two updates ago, not what it is now. That's misleading, and if you compare the "after" map to what it is now, there's no difference in Africa, the Americas, or Eastern Asia, only to Europe and West Asia. But the new "after" map doesn't include some new regions we know are going to exist (like Wales). So that map really isn't reliable and doesn't really tell us much. However, the map in the new white paper looks like it does include new areas. It's not interactive and doesn't let us zoom in to see details, but it does appear that there are indeed new regions in other parts of the world too, not just Europe and West Asia. I am not sure why the before/after map on the announcement page is not actually showing the new regions/breakdown when that is supposed to be it's sole purpose.
They've also already updated their white paper with the European PCA chart.
Here we see quite the breakdown into individual countries, but these are just where their samples come from and don't necessarily reflect how they might group the populations in our results. Like the last one this PCA chart doesn't really show much difference between Portugal and Spain, so attempts to split them up might not be accurate. And of course, we are still seeing massive overlap among all of Northwest Europe. The British Isles, Germanic/France, and Scandinavia all share a significant genetic overlap that still makes them difficult to tell apart in many cases. There are some German and French samples not a part of that group, but there are also many which are. This is understandable since France also shares some overlap with it's neighboring Spain, while Germanic Europe shares DNA with it's neighboring Eastern Europe.
But particularly in regards to the new results splitting up regions like Ireland and Scotland, or England and Wales, I'm skeptical about the reliability of that since the PCA chart shows no new genetic distinction between them.
Additionally, I noticed that European Jewish is missing from the PCA chart, which is a shame because it's always interesting to see how genetic unique they are. And as ever, the PCA chart only includes Europe for some reason, we never get to see ones for other areas, which might be enlightening.
This will be AncestryDNA's third update in three years - does this mean we can expect the norm to now be an update every year, even if it's only some tweaking to the algorithm? We can only wait and see.
Friday, September 4, 2020
AncestryDNA's Inconsistent cM Totals
Recently, AncestryDNA added to the very little amount of DNA matching data they provide, the ability to see the longest shared segment with a match. This has been enlightening, because as many people have already noticed, there are some cases where the longest shared segment is greater than the total amount of shared DNA. Naturally, this isn't genetically possible, and it's left many people confused. AncestryDNA tried to provide an explanation for it:
"In some cases, the length of the longest shared segment is greater than the total length of shared DNA. This is because we adjust the length of shared DNA to reflect DNA that is most likely shared from a recent ancestor. Sometimes, DNA can be shared for reasons other than recent ancestry, such as when two people share the same ethnicity or are from the same regions."
They are trying to keep it simple, but unfortunately I think it serves only to confuse most people even more. Here's what this means.
AncestryDNA have a program called Timber that removes shared segments it believes are not identical by descent (ie, the shared DNA is not coming from an ancestor within a genealogical time frame, but rather from a shared ethnic background). What AncestryDNA's explanation is saying is that they are applying Timber to the total shared DNA, but not to the longest segment. This explains the reason for the inconsistency between the totals and the longest segment, but not the logic or reasoning behind the bizarre choice to apply it to one and not the other. If you find this frustrating, you're not the only one.
What does this mean for the inconsistent shared totals with a match between parent and child? Well, I've noticed that often, when the totals are inconsistent, so is the total and the longest segment, and this tells me the same Timber action that's removing segments from the totals but not the longest segment is probably what is causing the inconsistent totals between parents and children.
Take for example, this DNA match "RB":
RB shares 39 cM across 2 segments with me, longest segment 47 cM
RB shared 19 cM across 2 segments with my mom, longest segment 47 cM
So, my mom and I both actually share one 47 cM segment with RB, but Timber has removed a chuck in the middle of that (making 2 smaller segments). Generally, that's not necessarily a bad thing if that chunk isn't identical by descent, but for some inexplicable reason, Timber took a larger chunk from the shared DNA with my mom than with me. That shouldn't be happening, because it's the same segment, it should be removing the same amount from each. Instead, it's taking the same shared 47 cM segment and removing 28 cM from one person but only 8 cM from the other, and that doesn't make sense, and doesn't exactly instill much confidence in Timber and it's reliability.
My theory on why this is happening is that it may have to do with endogamy. Most of the matches I've noticed with this problem on are my mom's side, particularly from endogamous branches. Granted, my dad has some endogamous branches too, but my mom has a fairly recent Mennonite branch, who are highly endogamous, and many of these matches are from that branch. I don't know whether endgamy is maybe messing with Timber, or Timber is trying to remove endogamous segments, but whatever it's doing, it shouldn't be doing it so inconsistently, and frankly, I can't believe this issue has gone on for so long unresolved (except it's Ancestry, so I can believe it).
Edit (24 Sep 2020): Recently, AncestryDNA added to the DNA data they provide the "unweighted shared DNA" total - which is the amount of DNA you share with a match before Timber is applied. You can find it by clicking on either the longest segment data or the shared total for more information. This means the inconsistencies between the total and the longest segment make more sense, and so do the matches where I share more than my parent does, but I fear it's only going to cause more questions about what an unweighted total is, why there are two totals, why they are sometimes so drastically different, and which total do we rely on? Theoretically, we should be able to rely more on the weighted (Timber) total, but since I don't trust Timber, there is no easy answer to the last question.
But at least I can now see the original total with matches, which unsurprisingly is now much more consistent with the original total they share with my parent. There are a couple that still have a discrepancy of 6 cM or less, but that's somewhat nominal, I suppose.
Friday, August 21, 2020
Major Breakthrough with DNA
Until now. I decided to work on some closer DNA matches that I hadn't been able to identify before. I randomly picked one from my mom's side who had several shared matches with people confirmed from my Mills branch. This match, we'll call him 11B, had a small family tree added, enough that I could build on it. Although that is supposed to be ThruLines' job, it doesn't always catch everything. I started digging and before long, I found that 11B's 2nd great grandmother was Orannah Sherwood b. 1841 in New York.
I instantly thought she could be a sister of my Emma Elizabeth Sherwood. Right surname, born only about 3 years apart in the same state. Plus, I know this DNA match 11B is somehow connected to my Mills branch and Emma Sherwood married William Henry Mills. But I tried not to get my hopes up too high, because Sherwood is a common name, and lots of people lived in New York in the late 1830s/early 1840s. 11B could be connected to my Mills branch in some other undiscovered way entirely. More research was needed, so I researched the other branches of 11B's tree and found no other connection to my tree, let alone to my Mills branch.
I then found Orannah, fortunately not a super common given name, in NY in the 1850 census and guess what? She had a sister named Emily E Sherwood b. abt. 1837.
![]() |
| The 1850 census showing the Sherwood family with Emily/Emma |
Things are looking much more promising. Granted, Emily was supposedly born in Indiana according to the 1850 census, not New York, but that could be wrong. Or it could be right and she never knew it. Her older sister Louisa also seems to have been born in Indiana in 1835, and then her younger brother Homer was born back in NY in 1839, so the family could have been in Indiana for only a few years and Emily/Emma may not have remembered it and just assumed since she grew up in NY that that's where she was born. It's strange for us today with all our documentation to think that someone didn't actually know where they were truly born, but it happened a lot in history.
Another smaller piece of evidence is the fact that the 1850 census tells us Emily's father, Nathan, was born in New York, which is consistent with later records of Emma saying her father was born in New York too. Unfortunately, it's not as consistent with her mother, which later records say she was born in either New York or New Jersey, while the 1850 census for Annis O, the presumed mother of Emily, says she was born in Vermont.
Here's the craziest bit, though, and is a real testament to why you shouldn't just outright dismiss family stories. Once upon a time, my grandmother was doing genealogy research and left behind a wealth of information, though rarely cited her sources. Much of what she wrote down was word-of-mouth info from cousins she tracked down and wrote to. In her handwritten info, she claimed that William Henry Mills (Emma Sherwood's husband) had a sister named Belinda who married a man with the surname Beals. Turns out, William did have a sister named Blendena, which was obviously misremembered as Belinda, but her only married name was Church, not Beals. None of William's other sisters or relatives married anyone named Beals either, so I was really scratching my head over where this name came from and considering that maybe it was totally fictitious, even though about 90% of my grandmother's info I've proven to be accurate, and the remaining 10% has turned out to hold some kernel of truth, with only some of the details being wrong.
Well, guess who did have a sister whose married name was Beals? Emily Sherwood! Her older sister Louisa married Silvanus Beals in 1855 in Indiana. And note how this is the same sister who was supposedly born in Indiana? The family probably had some kind of connection to Indiana.
I even managed to explain how Emma and Louisa wound up marrying in different states in the same year. Louisa's husband, Silvanus Beals, apparently was living in the same county that Emma married William Henry Mills in, Wyandot County, Ohio. That links Silvanus, and therefore potentially also Louisa, to the same place Emma was married. Additionally, Silvanus' obituary says he worked for a railroad company as a young men, the same industry that William Henry Mills spent his life in. Perhaps they worked together before they met their wives, maybe Louisa introduced Emma to William through her fiance or vice versa. There clearly appears to be a connection there.
The evidence is starting to really pile up, but is it all just a coincidence? How could I know for sure this was the right family, given the slight difference in the given name, Emma vs Emily, and the difference in her birth place as well as her mother's birth place?
Firstly, I started researching Emily, not Emma, as though she was a different person. If I could find her on later records as having married someone else, not William Henry Mills, or never married at all, that would disprove the theory that they were the same person. I didn't find anything like that, but of course that doesn't confirm they were the same person, it only means that's still a possibility.
I also found Emily in the FamilySearch tree as Emma, which is apparently coming from a book "Descendants to the eight generation of Thomas Sherwood (1586-1655) of Fairfield, Connecticut Vol 2" which was published in 1985, so it's obviously very much a secondary source (and really doesn't contain much info), but it certainly suggests Emily's name could have actually been Emma. It's not a stretch.
But what I really wanted was to find more DNA matches descended from this family. I was hesitant to put this family into my tree because it meant putting a lot of speculative data in my tree, but I did it because I wanted to see if ThruLines would find more descendants. And after a few days, the matches came rolling in! 7 so far, and they will only continue to grow as my tree grows. Unfortunately, this family has been a little difficult to research, so it's been a struggle, but worth it.
![]() |
| ThruLines showing 5 out of 7 DNA matches from the Sherwood family so far |
It appears that Nathan probably died sometime in between 1853 and 1855, and Annis in either 1854 or 1855, because their last child was born 27 Mar 1854. As a result, the children were split up and scattered, sent to live with other families. In 1855, we know that Lousia got married in Indiana, and Emily/Emma, assuming they are the same person, was married in Wyandot County, Ohio. They may have been living with family in those areas. Also in 1855, Oreannah was sent to live with the family of her future husband, Charles C Baxter. Their brother, Homer, was an apprentice living with a seemingly unrelated family in a different part of NY on the 1855 NY State census. Another brother, Dwight, was adopted by another member of the Baxter family, who was fortunately neighbors with the ones who took Oreannah in, so at least these siblings got to be near one another. The youngest brother, Frank, was actually born in March 1854 and adopted as an infant by Franics Postel and Sarah Baxter (Sarah being the sister of Oreanna's husband, yet another connection to the Baxter family) before the 1855 NY census, supporting the theory that Nathan and Annis died around that time.
I am still working on researching the other children, but I'm having difficulty and I think it's because they were all split up after their parent's deaths. If I'm having difficulty researching them, others probably are as well, and indeed, when I look for these people in other trees, there are usually dead ends. If no one has these people well researched in their trees, ThruLines doesn't have much to follow. So it's not necessarily because I'm on the wrong path, there's just no established path yet for ThruLines to pick up on, which is kind of exciting to be working on something no one else has done much work on yet. Of course, the downside to that is how difficult it is.
Additionally, when I look at my Shared Matches with the confirmed matches descended from Nathan and Annis, I find most of them don't have any tree added at all, and among those that do, most of them are tiny. Another hindrance of ThruLines. All I can do is build my own tree as much as possible down descendant lines and see if they eventually link up with more trees. For now, this is an excellent start, and I'm thrilled to finally have found Emma's family!
Thursday, August 13, 2020
MyHeritage's Photo Enhancements
Normally, both tools are limited to 10 photos with a free account, so you have to subscribe with the Complete Plan (the most expensive one) to use unlimited photos with these tools. But right now, MyHeritage are trying to entice people to subscribe by making the tools unlimited for free for one month. They are obviously hoping people will be so impressed with the tools and get used to using them on unlimited photos that when the month is up, some will subscribe to continue having access to them. But personally, I'm not about to spend another $300 a year just for access to these fun little tools so I'm making the most of the free access while I can.
Much like the colorizing tool, the enhancement works best on images that don't have too much degradation or blurring. If you click the above photo of my Nan to enlarge it and see details, you'll see it had only some minimal blurring and the enhancement tool made it very sharp and clear, a much better picture of my Nan. You'll note that it does not remove scratches, spots, or other surface damage to the photo though, even when they appear on the face. And yes, you can enhance it and colorize it at the same time (see examples below), I just chose not to on this one of my Nan to show you the enhancement alone.
It also works best on faces that are closer to the camera - the smaller/further away the faces are, the less effective the enhancement is, and sometimes it's not effective at all. A few photos I've tested so far (see below), the faces were so far away and so blurry that the tool didn't even attempt to enhance it (though it did seem to identify it as a face since it colorized it correctly as skin colored). The ones that were enhanced were minimally done.
![]() |
| The enhancement tool only worked on 3 out of 5 faces here, because they were too small and blurry. The 3 enhancements were minimal too (see below). |
![]() |
| A close up comparison of one of the small faces in the above photo with the minimal enhancements |
Additionally, sometimes the enhancement leaves the face looking a little plastic and weird, like the person is wearing a mask (see below). This is more likely to happen the more blurring there is to the photo and faces, partly because it's difficult to enhance something so small and so unclear, but also because the tool only enhances faces and nothing else. A sharp, clear face next to blurry hair and clothing just looks weird. But in some cases, it's better than nothing, and it does give us somewhat of a better idea of what someone looked like.
![]() |
| Note how the one on the left looks fairly normal but the other two appear mask-like |
Keep in mind though, that this tool is attempting to create data where it doesn't exist, so there comes a point on a heavily doctored photo where it may not be an accurate representation of someone's face. It's fun to explore, but for example, I would avoid using it while comparing people in two different photos to determine if they are the same person, or related. While it's tempting to use enhancements to do such comparisons because they seem clearer and sharper, making it easier to compare, it could actually be wrongly altering someone's appearance and leading you to the wrong conclusion about their identity.
So just like with the colorizing tool, the effectiveness of the enhancement tool can be a little hit and miss. It handles some images better than others, and there does come a point where certain photos and faces are too far gone to recover. Have fun with it, but don't expect too much from it with all your photos.
Wednesday, August 12, 2020
Changes at Ancestry.com
Cue the freak outs.
But really, everyone, it's going to be okay. Here's why.
AncestryDNA are raising the threshold for matching from 6 cM segments to 8 cM. I know this seems extreme, but remember that the vast majority (thousands) of your matches under 8 cM are identical by state, which means they do not share a common ancestor, at least not within any kind of genealogical time frame. And even those matches which you can identify a most recent common ancestor with, at this level of DNA, it's so unreliable, you can't be sure the shared DNA is actually coming from that ancestor after all. Because of this, these low matches can actually be leading you astray, not breaking down the brick walls you thought they would. By raising the threshold to 8 cM, AncestryDNA are assuring that the majority of your matches will be identical by descent and therefore more likely to be most useful to your research.
In fact, in the past, AncestryDNA was often criticized for their threshold being as low as 6 cM, as at least 7 cM was considered more the standard. And if you think 8 cM is extreme, don't even bother testing at 23andMe, where rather than have the same cM cut off point for everyone, instead they cap your match list at 2,000 matches (or if you tested long enough ago, it may be 1,000). Whatever cM your matches share with you at that 2,000 cut off is where they draw the line. So, for example, let's say your 2,000th match shares 12 cM with you - they will include everyone that shares 12 cM with you even if it goes above 2,000, but that's it, that's your cut off point, you won't have any matches sharing less than 12 cM with you. Personally, I was unfortunate enough to test when the cut off was 1,000, and they didn't raise it. My cut off point at 23andMe? 20 cM. That would basically only be my estimated 4th cousins or closer at AncestryDNA. Imagine your match list being cut off at only estimated 4th cousins or closer.
Additionally, AncestryDNA have promised not to remove any matches that you have marked in any kind of way. If you starred them, put them in a group, left a note, or messaged the individual, those matches, even under 8 cM, will remain on your match list. So you're not going to lose any info that you've already established, only the ones that you haven't gotten anywhere with yet, which are the ones most likely to be identical by state anyway.
So AncestryDNA are not being unreasonable by raising their cut off to 8 cM. It's more in line with what is considered standard, it's still way better than the crappy deal you get at 23andMe, and you won't lose any established data. What I recommend doing is going through all your ThruLines or matches under 8 cM with Common Ancestors and star or group them somehow, so you at least don't lose those. For me, at least, this is worthwhile because most of my ThruLines wind up being accurate. You may also want to star ones that have trees - the ones that don't, you probably wouldn't get very far with anyway. You can easily do all this by going to your match list, selecting "Common Ancestors" and then under "Shared DNA" select "custom centimorgan range" and put in 6 to 7. For those with trees, click "Trees" and alternately select each of the options. This will help prevent you from losing those low matches which have some chance of actually being useful.
Now let's look at the second news: a change in ownership. When the news first broke, there was a lot of shouting about how the company taking over is a private equity firm, as though this is some of dirty word that we should all be terrified of. Well, guess what? The main company that's selling, Permira, who have been the primary owners of Ancestry for the last 8 years, are a private equity company too. The company is merely changing hands from one private equity company to another. (For the record, there are a few other companies that also held shares in Ancestry. and two have also sold to Blackstone, one is retaining a minority ownership along with Blackstone. They are also private equity companies, but Permira was the primary share holder, as Blackstone will now be).
Of course, any time ownership changes, it could mean changes for the company. People mainly seem concerned with their DNA and who has access to it. Blackstone responded to this by making a statement reassuring users that they won't actually have access to DNA data:
"To be crystal clear, Blackstone will not have access to user data and we are deeply committed to ensuring strong consumer privacy protections at the company," a spokesperson for Blackstone told Motherboard in an email. "We will not be sharing user DNA and family tree records with our portfolio companies."
Of course, companies can lie or change their mind, but there's no reason to think that's going to be the case. Remember, Ancestry was in the hands of another private equity company for 8 years up to now and no one seemed to have a problem with that.
But wait, I hear people saying, the concern is that Blackstone have their fingers in the health industry, which surely means they acquired AncestryDNA to mine genetic data for the health companies they own! Our DNA is going to be sold or given to other companies without our consent!
It's true that Blackstone also has investments in the healthcare industry, that's what private equity companies do - they invest in other companies and frequently have investments in multiple different industries. But guess what? So does Permira. Yep, Permira also has investments in healthcare, yet that was never a problem for the 8 years that Permira were the primary owners of Ancestry.com and their massive DNA database.
Look, I'm not going to say nothing could ever happen to the security and privacy of your genetic data. Hacks happen. Illegal deals happen. Companies can violate their own TOS. But that's always going to be a risk, no matter the company you tested with, and no matter who owns it. This particular sale doesn't mean it's anymore likely than before or with any other company. If it really, deeply concerns you, then you shouldn't ever have your DNA tested anywhere, and if you already have, you should delete it immediately. If you understood the potential risks (which are low, in my opinion) and were okay with them before, there's no reason to suddenly be concerned now.
So before you buy into all this fear mongering, just do what genealogists always do: research! Before you freak out, do some research about these companies buying and selling Ancestry. Do some research about the validity of low DNA matches. You might come to the same conclusion I did. And if you don't, fair enough, at least you did your research and came to an informed decision, which is more than I can say about most of the fear mongering going on.
Wednesday, July 22, 2020
Best Friends Forever? Not Quite. The Original Bride Wars.
![]() |
| The best of friends, for a time: May Ellis (left) and Emma Fallows (right) sitting on the back patio of Emma's parents house |
![]() |
| May Ellis (left) and Emma Fallows (right) sitting on front porch of Emma's parent's house |
"The Bunch" at the beach in Ocean City, Maryland, 1908. Top photo: Emma (left), Boyd, and May (right). Bottom photo: Emma (left), Harold, and May (right).
Emma and May (with friends) "At Fretz's" place (Florence Fretz, Emma's Maid of Honor). Top: May (far left), Emma (second from left). Bottom: Emma (far left), and May (middle). Florence may be the other woman in the photos, or may be taking the photo.
![]() |
| "The Bunch" - Emma taking a photo of Harold (second from left), May, and Boyd (right) with unknown man (far left) |
![]() |
| Emma (third from left) with friends during one of her visits to May's home in Delmar, DE. May is probably taking the picture. |
"The Bunch" goofing off at an unknown location. Top photo, from left to right: Boyd, May, Emma, Harold. Bottom photo, from left to right: Emma, Harold, May, Boyd.