
 |
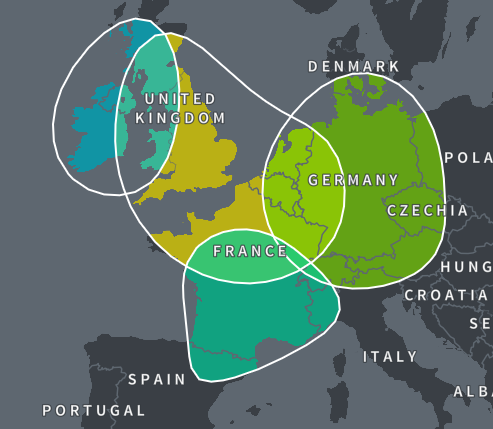
| My paternal grandfather's new AncestryDNA ethnicity map |
My theory is that the update seems to work best for people who are less mixed. Unfortunately, this doesn't bode well for most Americans since most of us are fairly mixed and come from multiple backgrounds. I believe this is why my report became less accurate with the update - I am a mixture of Italian, British, German, Norwegian, and a little bit Dutch and French. But my paternal grandfather, on the other hand, isn't very mixed at all. He's basically around 60% German and 40% Scottish or Scots-Irish, and although his results don't exactly match his tree, the new update is much more accurate than it was before.
 |
| My paternal grandfather's original AncestryDNA ethnicity |
Great Britain 67% (range 43-87%)
Europe West 15% (range 0-35%)
Caucasus 10% (range 5-16%)
(Low Confidence Regions)
Italy/Greece 5% (range 0-14%)
Scandinavia 1% (range 0-7%)
European Jewish 1% (range 0-4%)
Iberian Peninsula < 1% (range 0-4%)
Europe East < 1% (range 0-3%)
With the update (also see map above):
England, Wales & Northwestern Europe 67% (range 62-100%)
Germanic Europe 23% (range 22-23%)
France 6% (range 0-9%)
Ireland and Scotland 4% (range 0-5%)
Remember, as I pointed out before, even though the category is now called "England, Wales, & Northwestern Europe, it covers the same area as before, including Scotland. The update is still leaning more towards his British background when his tree suggests he is more German, but the loss of all those low percentages in regions that didn't match his tree make it much more accurate than before. They also eliminated the unexpected 10% Caucasus, which wasn't even a low confidence estimate and so simply dropping that has made it much more consistent with his tree. Also, keep in mind that while we inherit 50% from each parent, we do not inherit exactly 25% from each grandparent, or 12.5% from each great grandparent, etc. So when I say my grandfather's tree suggests he's 60% German and 40% Scottish, that is very much an estimate because it's based on simply dividing each generation by half, which isn't actually how inheritance works. It's entirely possible he inherited more DNA from his Scottish ancestors than his German ones, even though he had more German ancestors than Scottish, and therefore the lean towards British over German in his ethnicity report could be entirely accurate.
 |
| My paternal grandfather's new AncestryDNA ethnicity |
You may notice something weird about his new ranges though. As far as I know, they are still calculated by running 40 different analyses and than averaging out the results to get your final percentage, with the range showing the lowest and highest scores you got out of those 40 analyses. For England/Wales, my grandfather's range is as high as 100%, but that means every other category must have a range as low as 0%, and they don't. For Germanic, his range is 22-23%. It seems as though AncestryDNA are excluding the 0% in Germanic as an outlier - which I wouldn't have a problem with, but if they are going to do that, it means they should also be excluding the 100% England/Wales outlier too. Granted, it is still supposed to be in beta mode, so this could change as they continue to tweak things.
My husband is even less mixed than my grandfather. He is from England, born and raised, with a Catholic Irish father and Protestant English mother (which apparently caused quite the problem in their family when they married). On his mother's side, he actually has a Scottish branch and another Irish branch if you go back far enough, so he's about 60% Irish/Scottish and 40% English, and of course 100% British Isles.
 |
| Husband's update and comparison with old report |
Ireland/Scotland/Wales 67% (range 50% - 79%)
Scandinavia 12% (range 0% - 27%)
Europe South 9% (range 1% - 16%)
Europe West 6% (range 0% - 23%)
Low Confidence Regions:
Iberian Peninsula 5% (range 0% - 13%)
Great Britain 1% (range 0% - 8%)
And with the new update:
Ireland and Scotland 61% (range 45% - 76%)
England and Wales 38% (range 34% - 38%)
Benin Togo 1% (range 0% - 1%)
Wow! Apart from that weird 1% in Africa, which is obviously just noise, the new results are almost exactly what his tree says and support the idea that the less mixed you are, the more accurate the update may be for you.
Here again, were seeing inconsistencies with the ranges. How can one category range by 31% when the only other two categories only range by 1% and 4%? In order to have gotten 45% as the lowest score for Ireland/Scotland, the rest of his categories must have added up to 55% to make 100%, but neither of them have that high of a result as their maximum in the range. This again suggests that they are sometimes excluding outliers, but oddly aren't doing it consistently. I will be eager to see more details when they finally release them. Understandably, they have not given us much information (none at all, really) on their methods for the update because it's still in beta mode.
 |
| Dad's update and comparison with old report |
Previously:
Italy/Greece 44% (range 31-55%)
Europe West 19% (range 0-43%)
Great Britain 15% (range 0-35%)
Ireland 7% (range 0-19%)
Low Confidence Regions:
Middle East 5% (range 0-10%)
Scandinavia 4% (range 0-16%)
Caucasus 4% (range 0-10%)
Finland/Northwest Russia 1% (range 0-5%)
Asia South < 1% (range 0-2%)
Updated:
Italy 44% (range 43-58%)
England and Wales 24% (range 23-24%)
France 12% (range 0-13%)
Ireland and Scotland 10% (range 0-10%)
Germanic Europe 3% (range 0-27%)
Greece and The Balkans 3% (range 0-3%)
Sweden 2% (range 0-2%)
Turkey and the Caucasus 2% (range 0-2%)
It's good to see his Italian/Southern Europe results didn't change, considering mine changed so drastically (and wrongly). His are still 44% and now narrowed down to Italy, not just Europe South. And the 24% England/Wales is fairly accurate too considering, again, that despite the name it does primarily include Scotland as well. But they did fail to identify much German and he's still getting several noise-level results. Noteworthy though is the fact that if they were still using the old low confidence regions, everything apart from Italy, England/Wales, and Germanic Europe would be in low confidence, which is consistent with his tree. The criteria for it is described as:
"When an ethnicity has a range that includes zero (meaning that in at least one of the 40 tests, that ethnicity didn’t appear) and doesn’t exceed 15%, or when the predicted percentage is less than 4.5%, the ethnicity is included in an estimate as a low confidence region." - Full article here
So despite his low average for Germanic, the range is as high as 27% and that would be above the criteria for the low confidence regions. Looking at it that way, his new results for mainly Italy, England/Wales, and Germanic are actually kind of accurate.
 |
| My mom's previous AncestryDNA ethnicity report |
Lastly, we come to my mom's new results. Her background is more mixed than my dad's, so it's not surprising that her update isn't quite as accurate. She is approximately 50% British (English and Scots-Irish), 25% Norwegian, 20% German/Swiss, and possibly a tiny 2-3% Dutch and 2-3% French.
Her previous results (show left):
Great Britain 46% (range 10-81%)
Scandinavia 29% (range 2-57%)
Europe West 16% (range 0-44%)
Ireland 4% (range 0-14%)
Italy/Greece 3% (range 0-8%)
Iberian Peninsula 2% (range 0-7%)
With the update (shown below):
England, Wales & Northwestern Europe 45% (range 43-52%)
Norway 40% (range 38-40%)
Ireland and Scotland 11% (range 0-12%)
Sweden 4% (range 0-4%)
 |
| My mom's new AncestryDNA ethnicity report |
Her British results haven't changed much, but her Norwegian/Scandinavian results are now much, much higher than before, a drastic deviation from the fact that she only had one Norwegian grandparent. While the amounts we inherit from a grandparent may vary, it's unlikely to be as high as 40%, much less 44% if you add in the Swedish results. But most importantly, where did her German ancestry go? The update definitely seem to be underestimating German results in general, at least for my family. At least my dad got small results in Germanic - but none at all for my mom?
The ranges are generally smaller than they used to be, which suggests better confidence or more consistency in the results, but is that because in some cases, they are excluding outliers? Hard to say until we get more information on their methodology.