
 |
| Selecting a custom report. Click to enlarge. |
Step 2: Make sure that the small pedigree chart at the top showing you which individual from your tree is selected is on yourself or the "home" individual.
Step 3: You should find a list of different types of reports and charts available on the left. Select "Person Reports", then "Custom Report". To the above right is a screen shot showing you these steps - don't mind the black boxes over the pedigree chart, that's just to protect the privacy of living individuals.
 |
| Items to include icon. |
This will bring up a list of facts with the option to add or remove them, plus some flexibility in what to include with/of each of those facts. On the right are some general options that will apply to all facts and under the list of facts it will have a button saying "Name Options" (Name being the first fact highlighted, click on other facts to get the same option for them) and within this you can customize each fact.
 |
| Adding facts to include. |
Next, I went into the birth, marriage, and death fact options and made sure "Description" and "Include 'in' before place" were deselected (they might already be deselected by default, I can't remember since I have long since played with the settings). This is a personal preference, you don't have to do this, I just found it unnecessary data for this purpose and therefore it was cluttering. I've included a screen shot of this below even though it's not a necessary step. Feel free to customize any other settings - notice that in step 5 (above) I've also deselected options like "Include person notes".
 |
| Minimizing "clutter" by removing irrelevant data is optional |
So we've added the facts we want included, now we have to customize the individuals from our tree we want included. This is done under the right panel in "Custom Report Options" (shown below).

Step 6: When you choose "Selected individuals", a new window should pop up (if not, just click "Individuals To Include"). Click "Ancestors" (shown below) - this will include all your direct ancestors (making sure you indicate a sufficient amount of generations to include everyone - to be safe, I make sure it says 999) and, if you choose, also include other descendants of those ancestors and how many generations you want to go down. I usually stick to one generation but keep in mind this will include individuals who don't necessarily have children.


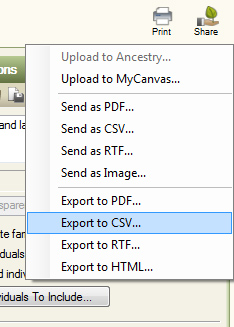
We're now done customizing the report - if it doesn't generate automatically, just click "generate report", a button at the bottom of the Custom Report Options. At this point, you could stop and just save and use the report as it appears in FTM. You can print it or save it as a PDF. However, depending on the size of your tree, you may find the file is 50+ pages long! How do you sort through all this data to learn from it? This is where spreadsheets are beneficial and the next part of this will explain how to export the data to a spreadsheet and use it effectively. Unfortunately, I don't have Microsoft Office at the moment so I will be using an Open Office spreadsheet instead of Microsoft Excel but whatever you're using, it should work similarly.
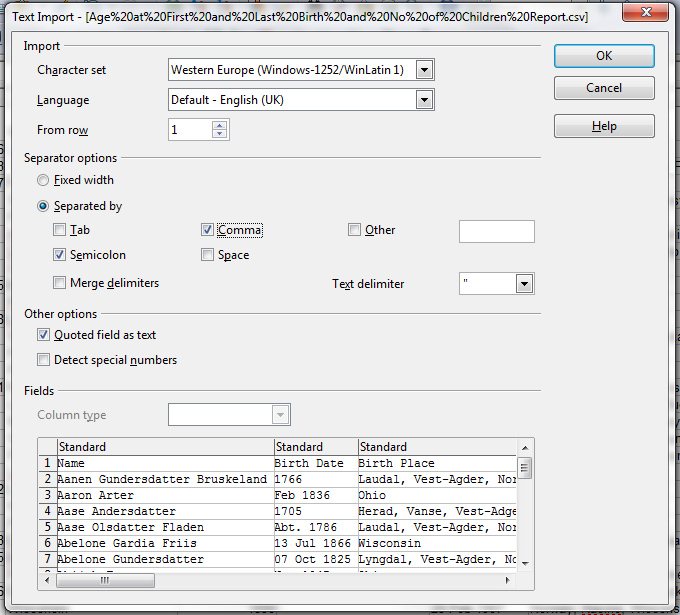
Step 2: You'll then get the save window where you can choose where to save the file on your computer and what to name the file. This is all up to you.
Step 3: Once you've saved it, you'll get another pop up window asking you if you want to open the file - click yes and it should open in your default spreadsheet program. If you don't have one, you can download Open Office (it's free and safe) or you can upload to Google Drive/Docs.
Step 5: You may find you have a lot of data for people who don't even have any children, which is kind of pointless for this task, if you mainly want to see the age of every individual at first and last birth. If you're happy with the information remaining, there is no need to do this. But as I've mentioned before, I hate clutter. So if you're like me, what you need to do is highlight the column for number of children and sort by descending. In the pop up window, choose "Extend Selection". This all shown below:

Now you can scroll down, highlight the rows for each individual who have 0 children and delete! Once your data is "clean", you can play around with sorting by age at first or last birth too and you can add up all the ages or numbers of children to get an average. If you're writing a family history, you can incorporate this information into it. I find it fascinating to see who and at what age the youngest and oldest person in my tree had children and what the average number of children was in my tree and how it compares to national stats from the times. Granted, you have to keep in mind that probably some of the families in your tree may not be complete and therefore you may have some people listed as only having one child when they actually had more that you haven't discovered yet. That will skew your averages - but it's better than nothing and you can always update it as you learn more.
This is just one example of how you can use these tools to manage and analyze your genealogy - you can apply these same methods to nearly any type of data within your tree. It really illustrates the kind of advanced management and analysis tools which are available with genealogy software in comparison with a simplified online tree. I often see people asking what the difference is and whether it's worth the money to buy software - this is a great example of why it is.
This is great tutorial about a part of FTM 2012 I did not even know existed ! Thanks .
ReplyDeleteI hope you show more tips like this in FTM 2012 .The spreadsheet information really helped me a lot. I have been reading all your articles this morning as I do Philly research too.
ReplyDeleteI'm glad it helped! I will be posting more FTM tips.
Delete