Showing posts with label review. Show all posts

Wednesday, April 13, 2022

More Ethnicity Updates from AncestryDNA

AncestryDNA is maintaining their annual ethnicity updates, and it's a little early this year. But it's a new kind of update - rather than the usual changes to either the reference panel, or algorithms, or both, this one introduces a new feature called SideView. It is essentially phasing our DNA with our DNA matches to determine which ethnicities come from one parent or the other. It also means adjustments to our individual percentages, which should theoretically be an improvement. Phasing is usually done with parents or other very close family members, so I was skeptical about AncestryDNA doing it with our more distant matches. Your parents don't have to have tested for this new feature to work, but I was hopeful that my parents having tested would make it more accurate.

I find the parental breakdown (shown above) is very reliable - at least, it's as reliable as it can be given how accurate (or not) each of my kits are to begin with. For example, it correctly identified that my Norwegian and Italian ancestry are from opposite sides of my tree, and that is true: Norwegian is on my mom's side, Italian is on my dad's side. But it puts all of my Germanic ancestry on my dad's side because my mom's results still don't include Germanic despite having a great grandfather of full German descent (dozens of DNA matches on this branch confirm there's no NPE) and several other German branches further back. 

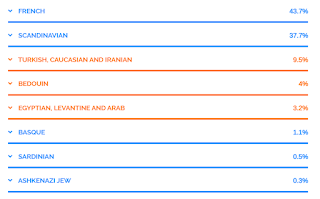
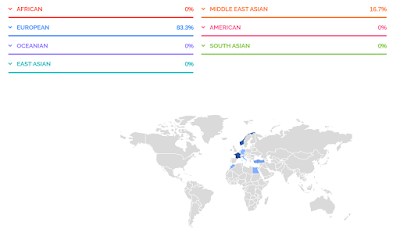
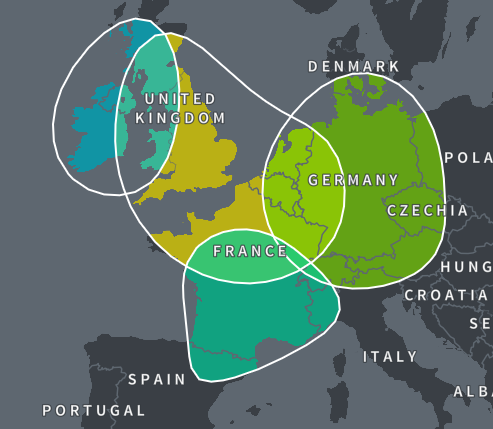
Looking at my mom's parental breakdown, shown above, (neither of her parents having tested), there is less reliability, that's partly due to the fact that her Norwegian ancestry is grossly exaggerated. She now gets a whopping 47% in Norway despite only having had one Norwegian (or Scandinavian) grandparent (so she should be about 25%, although it may vary, it shouldn't be more than about 36%). The majority of her Norwegian results does get put on one side, but that means there's not much room left for the other 25% on her mom's side that should be mostly English. Most of her English results get put on her other side, which isn't exactly wrong, she does have some English ancestry on that side too. But her dad's side should be mostly Germanic, and again, she gets no results in Germanic. If the percentages were more reliable to begin with, the split up would be more reliable too.

My dad's parental breakdown is very accurate, probably partly because his father tested but also because there is more genetic distinction between his mom and dad's sides - his mom was Italian, his dad mostly German and some Scottish and English. The split up (shown above) correctly shows all his Italian (Southern and Northern even though his ancestry is only Southern) plus trace amounts in Cyprus and Levant (obviously coming from his Italian ancestry) on one side, equaling exactly 50%. On the other side it correctly places all the rest of his ethnicities, although they are not all accurate - he wrongly gets results in Scandinavia where he has no known ancestry.

My paternal grandfather's parental breakdown is surprisingly very consistent with his tree, considering neither of his parents tested. On his paternal side, he is German with some English. On his maternal side, he's German and Scottish, with some English. Although his percentages are overall off (too much English, not enough German), the split up is accurately reflected here. English on both side, German on both sides (though barely), and Scottish on only one side.

My husband's parental breakdown (shown above) is also as accurate as possible given his percentage results and the fact that neither parent tested. It correctly identifies the majority of his Irish ancestry on one side and all of his English ancestry on the other side. His father was Irish, his mother was mostly English. He overall gets 40% in Ireland (a decrease from previous 47% which was much more accurate), and 36% is assigned to one side, his dad's side (shown below). His mother does have one Irish branch from much further back, which would amount to about 3%, and interestingly it puts 4% Ireland on his mom's side. Not bad. It then splits his Scottish results up more evenly on both sides - he does indeed have one Scottish 2nd great grandparent on his mother's side, so the Scottish portion being assigned to his father's side is obviously just due to the genetic overlap between Ireland and Scotland. His Scottish percentage is exaggerated to begin with: 22% when it should be more like 6% and probably no more than 12%, but interestingly the amount that is put on his mom's side is 9%, which is consistent with the Scottish 2nd great grandfather on his mom's side. Again, not bad, AncestryDNA, not bad. However, he has no Welsh or Norwegian ancestry, so those are obviously coming from genetic overlap with England.

So overall, the split ups among most of my kits were very reliable, but I can't say the percentages have benefited from the phasing. For example, my Scottish results wrongly shot up from 12% to 29% - based on my tree, the former is more accurate. And as mentioned, my mom is still lacking any Germanic results at all when she should be at least 12%, while her Norwegian results were already too high to begin with (43%) and just went up even more (47%). My dad's results didn't change by much, but he's now getting small percentages in incorrect regions that he didn't get before. In fact, most of my kits have seen this too - most of them now have small percentages in Ireland which they didn't have before. To my knowledge, all of my so-called "Irish" ancestors were actually Scots-Irish. So previous results were more accurate and the sudden appearance of Irish in results is disappointing (only because it's not accurate, not because there's anything wrong with being Irish, lol - obviously, my husband is half Irish).

Tuesday, February 1, 2022

TellMeGen Review

New DNA companies with the option to upload raw DNA data from other companies keep popping up, and honestly, it's hard to keep track of them. But recently, I tested one called TellMeGen out of curiosity. They offer reports on disease risk, traits, wellness, ethnicity, and even offer matching with other testers, all for free. But you know the saying, "you get what you pay for"? That's a little bit true here.

I can't really complain about the health and traits reports, they are easy to understand but also include the technical data if you want to explore that. They include reports on a lot of common health issues people want to know about, like cancer and heart problems. They correctly identified me as probably lactose intolerant, and having decreased levels of vitamin D. There aren't many Monogenic Diseases included, but that may just be because I uploaded from another company, so the data may not be there for some reports. It's always best to test with the company when they offer their own kit, but I can't afford to be buying all the DNA tests available out there.

But what we're focusing on is the ethnicity report, and I have to say it was not very consistent with my known ancestry at all.


 French 43.7%
 Scandinavian 37.7%
 Turkish, Caucasian and Iranian 9.5%
 Bedouin 4%
 Egyptian, Levantine and Arab 3.2%
 Basque 1.1%
 Sardinian 0.5%
 Ashkenazi Jew 0.3%

The only location/population here that's accurate is Scandinavian. I do have Norwegian ancestry, but it is not this high - more like 12.5% (one great grandparent), and other companies usually peg it even lower than that, suggesting I may have gotten than expected from my Norwegian great grandfather. I'm guessing that my inflated Scandinavian percentage includes my British ancestry, knowing there is genetic overlap between them.

I do have some very early colonial French Huguenot ancestry too, from the 1600s - but it amounts to less than 1% of my tree, so I do not consider it relevant to DNA ethnicity reports. Probably, the high amounts in France are coming from my neighboring Germanic ancestry.

Adding up the Middle Eastern results, I get 16.7%, which I can only imagine is coming from my Italian ancestry, though why it didn't come up Italian, I can't say. But even adding the Basque and Sardinian results in for 18.3%, it still doesn't add up to my expected amount of Italian ancestry, which I've detailed here many times as being about 32%. 

Although the 0.3% Ashkenazi is small enough to just be noise, knowing how endogamous the Ashkenazi population is and how reliable results in this category normally are, and should be, getting any results at all in this population when I have no known Jewish ancestry and get no results for it at any other company, is just another point against TellMeGen.

In short, my results simply do not make much sense. While it's not totally unreasonable to get some results in neighboring regions, this is a bit extreme, and if I have to jump through hoops to make sense of my results, it's not a reliable report.

Wednesday, November 27, 2019

AncestryHealth Results are in!

Recently, Ancestry.com announced the introduction of AncestryHealth, providing health and wellness reports for the first time. It costs $49 on top of the original DNA test price, and they are also offering a subscription (currently by invite only) that will include ongoing updates and new reports added in the future. This is very different to how other major testing companies offer health reports, subscriptions are not the norm and frankly I think it's a little cheeky from Ancestry, and I will not be paying the subscription.

But I did pay the one time fee for the current reports to see what they're like and the results are in. For people who tested particularly on the old v1 chip, your DNA has to be rerun through the lab because the raw data isn't ideal for the health reports they're offering, so it took a little bit of time for the results to come in.

AncestryHealth is offering 4 types of reports: Cancer Risk, Carrier Status, Heart & Blood Health, and Wellness Reports.

Under Cancer, there's currently only 2 reports: Hereditary Breast & Ovarian Cancer Syndrome, and Lynch Syndrome. They are careful to note that "No DNA differences found, but other factors may increase your chance of developing cancer." They also detail the fact that their test only includes 27 of the more than 2,400 DNA differences in the BRCA1/BRCA2 genes. None of the genealogy related DNA tests that offer health reports include all known SNPs associated with cancer (or any other given condition). The only consumer DNA test that does is Color.

Carrier Status includes 3: Cystic Fibrosis, Sickle Cell Anemia, and Tay-Sachs Disease.

Heart & Blood Health has 4 reports: Cardiomyopathy, Familial Hypercholesterolemia, Hereditary Hemochromatosis, Hereditary Thrombophilia.

And finally 8 under Wellness Reports: Beta-Carotene, Caffeine Consumption, Lactose Intolerance, Omega-3, Vitamin B12, Vitamin C, Vitamin D, Vitamin E.

Unsurprisingly, there aren't many reports yet and it doesn't tell me very much, at least not much that I didn't already know. It was much the same when 23andMe first reintroduced their health reports too, the only difference is, 23andMe continue to update and add new reports at no extra cost whereas AncestryHealth are charging a subscription for it. I'm not really sure why Ancestry think that this will be competitive pricing, as it will be far more expensive for users in the long run. MyHeritage recently joined the health band wagon too, and like 23andMe, do not require a subscription for new reports.

So is AncestryHealth worth the extra $49? Right now, not really. Maybe in the future as they add more reports, it will become more useful but it's unclear if merely buying the test in the future will gain you those new reports that I can now only get if I subscribe. Seems silly to punish people for being early customers, but at the same time if AncestryHealth Core (the non-subscription) remains the way it is with only 13 reports, it will be a pretty pathetic health report. Ancestry haven't been very forthcoming with the details on the subscription though. Unless they decide to drop the subscription idea altogether, I doubt very much I'll ever recommend AncestryHealth at all. 23andMe provides much more information at a lower cost (in the long run), but remember, even 23andMe is not comprehensive. Even Promethease, with it's hundreds of reports, is not comprehensive because the raw DNA data it's working off of is not comprehensive and only includes a small portion of our full genetic profile.

Friday, April 26, 2019

More Changes from AncestryDNA

Yesterday, I clicked on a match to discover the old "Match Review" page and the newer "Compare" page had been combined into one. I kind of figured that's where they were headed with the changes they'd made to the beta match list, but I was pleased to see it finally happened.

Previously, there were certain features and tools missing from the newer "Compare" page, but the new "Common Ancestors" wasn't featured on the older "Match Review" page meaning you often had to open both pages to make full use of your matches. Additionally, there was no way to add a match to a group from either page, you could only do so from the match list. All of that has been resolved now, and they also reduced the size of the profile pictures, which previously took up almost the whole page on smaller screens - a complete waste of space that only forced us to scroll down more to see any useful information. These were some of my top complaints and now they're all fixed.

As you can see from the screenshot above, everything you need to make use of your matches (well, everything that AncestryDNA current offers) is on the single new page. You can add and edit notes, you can add the match to a group, you can see how much DNA you share without even having to click on anything, the pedigree preview is there (with the option to open their full tree), and Common Ancestors will show on the left if there are any. There's also the option to click on a built in tab to see your compared ethnicity and one for Shared Matches.

Where are the surname lists and location map? Don't worry, they're just a little further down the page (screenshot to the right). The only disappointing thing is that these no longer show all the way back to 10 generations, and the pedigree preview no longer shows back to 7 generations. They are now all limited to a mere 5 generations, which seems much too restrictive in my opinion. That means they only include back to your 3rd great grandparents, which means they will only apply to as distant as 4th cousins! I think we can all agree that there are many, many more distant yet legitimately identical by descent matches than that. Even ThruLines/Common Ancestors goes back further than that (5th great grandparents, or 7 generations). What this means is if there's no ThruLines/Common Ancestor found for a match, we're going to have to open up more pages to explore most matches deeper for a common ancestor, and that seems counter-productive to an efficient workflow. It almost feels as though AncestryDNA is trying to force us to be more reliant on ThruLines than anything else, which would be a big mistake considering ThruLines will only ever be as reliable as the trees it's using.

If you agree with these complaints and/or have any others of your own, remember to keep sending feedback to AncestryDNA through the "Prodvide Feedback" option in the bottom right corner of your match list page!

Monday, March 4, 2019

New Tools from AncestryDNA

ThruLines from the DNA homepage,
you can still go back to DNA Circles
Last week, coinciding with RootsTech, both AncestryDNA and MyHeritage announced several new tools and features to help you get the most out of your DNA matches. AncestryDNA rolled out ThruLines, which it seems will be replacing DNA Circles, and New Ancestor Discoveries, although for now you can still access the latter two. They've also completely revamped our match list, though this is only available in beta mode if you enable it in Ancestry Labs available at https://www.ancestry.com/BETA (you can disable it in the same place if you wish).

ThruLines works by automating sort of what I've been advocating people do manually for years: build on your match's trees to find a connection. Instead of only looking at your tree and the trees of your matches (like Shared Ancestor Hints and DNA Circles did), ThruLines looks to other trees outside your DNA matches to make the connection between you and your matches by building on both trees (much like how the We're Related app worked). As with anything tree-related, be careful about the connections it makes - I noticed one potential ancestor showing up because the system decided my ancestor Kate White was the same as someone called Katherine Weiss, which is German for White, but my Kate White is Scots-Irish, not German. And of course even putting aside the system making connection errors, the research other users do on their trees may be wrong.

ThruLines details/pathway
So do your own research and confirm or deny the relationship, but ThruLines is a great way to get you started and bring potential common ancestors to your attention so you're not just aimlessly building your matches trees, unsure of what to look for. The best thing about ThruLines? Unlike with Shared Ancestor Hints, it will actually show you the common ancestor (and pathway to them) even for private trees! Hooray, no more seeing that you have a Shared Ancestor Hint and messaging people to ask who it's for and never getting a response! Of course, private trees are still private in that you can't view the rest of the tree without an invite, but at least you can see your common ancestor and the pathway by clicking on the "private" ancestors in each generation of the pathway (it will take you to a page that lists their name and birth details only, but this is generally enough to confirm or deny the pathway). In the screenshot to the right you can see the common ancestor found with one of my matches through ThruLines. Clicking the numbers will expand the pathway and show each generation. Ancestors in dotted lines indicate ones which ThruLine has found through other trees - note that it names the tree owner and if you have a subscription, you can click on that ancestor and see their tree if it's public. One thing I don't quite understand about ThruLines is that it doesn't group married couples together - above you can see only one ancestor, Elisha Mills, is listed. His wife is also included as a common ancestor but listed separately. Previously, Shared Ancestor Hints included spouses as a part of the same hint.


If you've enabled the beta match list, you'll see some quite drastic changes (shown above). Your match list is now on an infinite scroll, color/custom groupings have been added, and you have several new sorting and filtering options. I don't love the infinite scroll - although the additional sorting and filtering options does make an infinite scroll less cumbersome, it is still cumbersome when you consider you have literally thousands of matches. That's a lot of data for an infinite scroll and basically assures you'll never reach the end of the list even when using most filtering options to narrow the numbers down. Additionally, if your browser crashes or you have to shut it down for any reason, you will lose your spot in the infinite scroll. With pagination, you can just note the page you were on and jump back to it, but that's not possible with infinite scrolling. While you may be able to find the spot you left, it's still going to take time to scroll, scroll, scroll down until you finally reach it. Infinite scrolling is not very functional and I really hope AncestryDNA's developers reconsider it.

Custom groups offer 24 different colors (shown above and right), so you can now group your matches however you want, such as a different group for each of your sixteen 2nd great grandparent's branches, and then a few more for other options (like maybe a group for a certain location, or an unknown cluster you've noticed, or matches you've identified a MRCA with, etc). You can add one match to as many different groups you'd like and each group gets a name that appears if you hover over the colored dot. This may eventually replace what I've been using the emojis for in the notes section (you can see they are still in my screenshot above), but not just yet since at the moment, groups are only available on the match list page, not the match detail page(s). So I still need emojis as a visual reference on the match detail page. I imagine this may change in time. The new match list is, after all, an opt-in beta mode and I'm sure there are tweaks and additions to come. If groups get added to the match detail page(s) then emojis might become unnecessary, unless you're using more than 24 of them (I am not). The benefit of groups over emojis is that you can filter by groups. And although Chrome extension MedBetterDNA allows you to filter by hashtags, it was cumbersome since it only hid matches without the selected hashtag and did not condense them - so a match with the selected hashtag on page 50 of your matches would still be on page 50. That is no longer a problem with AncestryDNA's groups (or infinite scroll, although that has it's own issues addressed above), however, since groups are limited to only 24 options, whereas hashtags are unlimited (there's a limit of how many you can search at a time in MedBetterDNA, but you can use as many as you'd like), don't get rid of those hashtags either. I still have all identified surnames hashtagged (and will continue to add them) because groups being limited means I can only use them to identify branches, not individual surnames, as there would be too many surnames to use with groups. So groups will likely replace emojis eventually, with added benefit of filtering groups, but it will not replace hashtags used with MedBetterDNA. Additionally, MedBetterDNA's essential feature of being able to always show notes means this extension isn't going to become obsolete. It's functionality has been influenced by the beta updates, but the extension's developer expects to update it to work with the new match list once the beta goes public (likely a few weeks after the new match list gets pushed out to everyone).

Other default "groups" (shown above/right) that Ancestry provides allow you to only show 4th cousins or closer, only show distant matches, or hidden matches, and as before, only show new matches, starred matches (colored/custom groups being separate from starred matches), or matches with your mother and/or father (if they have also tested). In fact, it now identifies "Mother's Side" or "Father's Side" in the far right column if your parents have tested (shown above). Note this only includes estimated 4th cousins or closer, so if you want to include more distant matches with your parents, you'd have to create a group for it (which is exactly what I've done).

Under filtering, a separate drop down menu (shown left), you can view matches with a "Common Ancestor". This appears to be replacing Shared Ancestor Hints, and it will include speculative ThruLines, so it's basically just another way to view your ThruLines (viewing them by individual match rather than by ancestor, which is what you see when you click on ThruLines from your homepage). The major downside to this, and I have already sent feedback to AncestryDNA on it, is the fact that there is no way to view only matches which have an actual common ancestor in both our trees versus those which are much more speculative because it's finding connections through other trees. There should be a way to separate them, as there is a noteworthy distinction between them. If you find this problematic as well, please make sure to send them feedback in the lower right corner of your browser while in beta mode (shown below/right).

Additional filtering includes "matches you haven't viewed". In the past, there was a "new" button which showed all matches you hadn't viewed yet and you could sort them by relationship or date. This is now split up so you can view new matches by date (including ones you've viewed) from the "Groups" drop down menu, or view matches you haven't looked at yet which is sorted by relationship from the "filter by" drop down menu. Personally, I use the latter the most, because I've made a point of looking at each estimated 4th cousin or closer and trying to figure out how we're related, so now when new matches come in, I periodically just look at new estimated 4th cousins or closer and examine them to stay on top of it.

Among the new filtering options include viewing matches you've messaged, matches with notes (very useful!), and matches with private, public, or unlinked trees, the latter being something we've all been asking for for years! Finally!

Best of all, you can combine options between the "Group" dropdown and the "Filter by" drop down menu. So if you want to see matches who you've you've sent a message to and labelled on your Smith branch, for example, you can do that.

Clicking the circled items opens the old "view match" page with the pedigree preview, etc

All of these new features and tools could be hugely beneficial, but my main disappointment is in the organization of much of it. In the past, clicking on a match opened the "view match" page we were all used to, including all the most useful features: pedigree preview, surname list, shared matches, map/locations, notes, and the option to message, star, trash, or mark as new. Somewhat recently, there was also added a "compare" button that took us to a different page which showed the comparison of our ethnicity reports, which was very interesting, but typically not very useful. Now with the update, clicking on a match's username takes you to that "compare" page instead, which does include shared matches and potential common ancestors, but does not include the ability to add or edit notes! It also won't show notes of the shared matches listed. Fear not, the old "view match" page with the pedigree preview and other features is still available: from the "compare" page, you can click "pedigree tree" or you can go straight to it by clicking on the tree info in the third column of your match list (even if there's no tree or it's private) - see above (edit: this option has now been removed, in order to get to the pedigree preview page, you can now only do so from the "compare" page). The problem is, the old "view match" page no longer includes Shared Ancestor Hints - in order to view them (now called Common Ancestors, or Potential Ancestors as a part of ThruLines) you have to look at the "Compare" page. And in order to view the details of those potential ancestors (part of ThruLines), it will open a third page! On top of all that, groups can only be added from the match list page, meaning in order to use all useful features, you have to switch back and forth among FOUR different pages. I can understand ThruLines being on a separate page because it's very detailed, but I see no reason why they can't combine the "Compare" and "View Match" pages and/or add grouping to those pages. It's ridiculous that the features are split among them, it's going to make my workflow that much less efficient. If you feel the same, please use the feedback option to make sure AncestryDNA know!

If AncestryDNA could resolve the two bolded issues, it would be almost perfect - now all we need is a chromosome browser and we're all set, but apparently that's never going to happen due to "privacy" issues.

Coming soon, I'll detail the new features from MyHeritage.

Thursday, January 24, 2019

24genetics Review

My European countries map from 24genetics
24genetics offer DNA tests for health and ancestry related reports, and also accept raw DNA uploads from other companies for more limited report options. For the uploads, they only offer reports on ancestry, sport, skin, nutrition, and talent/personality. If you buy a test with them, you can also get health and drug response reports, but be aware that each one costs $149 - $199, and if you want all the reports, the "all in one" pack costs a whopping $399. This seems very expensive, and if you're looking for a health report, I wouldn't buy tests through this company, there are less expensive venues. 23andMe costs half this for their ancestry and health, and is on sale often enough you can get it for even less. 23andMe may not include all same reports, but you can then upload your data to other, inexpensive sources like Promethease for more.

Most of the reports from uploaded DNA say they accept data from 23andMe or AncestryDNA, except the ancestry report, which says it will accept DNA from 23andMe, FamilyTreeDNA, AncestryDNA, or MyHeritage. The ancestry test costs $49, and the rest cost $69. You can order a promo pack including ancestry, sport, nutrition, and skin for $99. These also seem expensive for what you get, considering they don't have to run your DNA through a lab, so I only purchased the ancestry report and uploaded my raw DNA data from 23andMe.

The report is sent in an email as a PDF, much like how DNATribes before they discontinued their upload offer. In the PDF, you get an ethnic break down of your DNA first on a continental level called "Global Vision", then a country level, and finally a regional level. Like most ethnicity reports, they say the results date back "hundreds and even thousands of years".

My country results from 24genetics
My continental results (deserving of all caps, apparently) say:

EUROPE 99.20%
ASIA 0.80%

Most likely, the Asian results are just noise. You'll see in the country and regional break down that my Asian results are in a part of Georgia, in the Caucasus area (just above the Middle East), so it's possible this is related to my southern Italian ancestry, but given the small percentage, it may just be noise and not mean anything.

My country results:

Great Britain 33.80%
Italy 30.00%
Austria 17.10%
Greece 8.20%
Netherlands 5.60%
Switzerland 2.30%
Finland 2.20%
Georgia 0.80%

The top two results are very accurate, my family tree is indeed roughly 32% British, and I did in fact inherit about 32% of my DNA from my Italian grandmother. But rest of the results aren't very consistent with my known ancestry. The smaller results could just be noise, and I'm guessing the Austria result is coming from my Germanic ancestry. I'm not sure where the Greek is coming from, since the only Mediterranean ancestry I have is already fully accounted for in my Italy results.

AncestryDNA's PCA chart showing reference panel
populations and their genetic distance to each other
The main thing it's missing is my Norwegian ancestry. Though I had one Norwegian great grandfather, my Scandinavian results often come back lower than the "expected" 12.5% on most ethnicity reports, so perhaps I inherited less from him than expected. I do get a trace amount in Finland, but as you'll see below, it's in an eastern part of Finland, which seems like it would have more in common genetically with Russia than Norway. In fact, AncestryDNA used to group Finland and NW Russia together. Although they now have separated the two groups, their PCA chart (left) shows that the Finnish group has no overlap with Scandinavia (let alone Norway), but does have some minor overlap with the Baltic States (northeast Europe, such as Estonia, Latvia, Lithuania). So I doubt there's any connection to my Norwegian ancestor. Norway usually has more in common genetically with Germanic Europe and Britain, so maybe the Netherlands results are coming from my Norwegian ancestry, but I do also have Dutch ancestry, though much further back on my tree.

Maps are provided for the results, first showing the highlighted countries on a global scale (above right), and then zooming in on Europe (above left). I guess my one small result in West Asia didn't warrant a zoom in.

My regional results
My regional results:

Essex Medieval 32.30%
Tyrol 17.10%
Apulia 15.80%
Lombardy 13.60%
Utrecht 5.40%
Crete 3.20%
Kythera 3.00%
Romandy 2.30%
Finland Karelia 2.20%
Andros 2.00%
Cornwall 1.50%
Georgia Svaneti 0.80%
Treviso 0.60%
Groningen 0.20%

Essex Medieval is an interesting result because it specifies a time period as well as location. I wonder why the other results don't include a time period? I do indeed have ancestry from Essex, although there's a few branches from there, they are all from fairly far back on my tree, in the 1500s. I suppose that's consistent with the Medieval timeline, however, they seem to be attributing almost all my British ancestry to Medieval Essex, yet I have British ancestry from many other locations, some from much more recent time periods too (which should account for more of my DNA).

My European regional map
Tyrol is a region of western Austria which borders Germany and Switzerland, both places where I do have ancestry from, so I'm assuming that's where this result is coming from.

Apulia is an area of southeast Italy. I have no known ancestry from there, but my Italian ancestry is indeed southern/Sicilian, not northern, so I'll give it points for that. However, Lombardy and Treviso are a part of northern Italy, where I have no known ancestry.

Next is Utrecht, a city in the Netherlands. I don't know where in the Netherlands most of my Dutch branches come from, but one of them is actually from Utrecht, and another from Amsterdam. But let's face it, the Netherlands is a pretty small country (though it was once larger), so I'm not really sure how distinct DNA from different parts of it really are from one another - Amsterdam is really not that far from Utrecht (about 27 miles). Although this is a small percentage, my Dutch ancestry is from far back on my tree, so I would expect it to be a small percentage, if it would show up at all. I also get a very small hit (possibly noise) for Groningen in the Netherlands, where I don't have any known ancestry.

My Asian regional map, probably
noise
Now we get into percentages so low they may only be noise. Crete, Kythera, and Andros are all in Greece, which again, I have no known connection to. Maybe some of it is related to my Italian ancestry, but it can't be all of it, or that tips my Italian percentage over the edge of being too much. Romandy is a French speaking part of Switzerland, and I do have both French and Swiss ancestry (again, far back on my tree), so perhaps there's some legitimacy to this. Karelia is an eastern part of Finland I have zero connection to (again, it's unlikely it's from my Norwegian ancestry, and I have no known ancestry in Eastern Europe). Cornwall is the southwestern most part of England, which I have no known ancestry from, but could still be a legitimate part of my British DNA. Svaneti is a historical area of Georgia, which may just be noise or could be coming from my Italian ancestry.

Overall, I feel like my top most results from this company are accurate but it's missing significant locations and the smallest percentages are likely just noise. An interesting assessment, especially the more specific break down that you don't always get from other companies, but as with any ethnicity report, don't take it too literally. Worth the money? Probably not, maybe if it was cheaper.

Sunday, September 2, 2018

Review of AncestryDNA's New Ethnicity Estimate Update (Beta) - Continued

My paternal grandfather's new AncestryDNA ethnicity map
Previously, I went over my new, updated results with AncestryDNA's ethnicity estimate and detailed what's different in general and with my personal report. I was mostly disappointed with my update because although the regions were more specific areas, it became less accurate in comparison with my tree, but now I want to get into the results of the other kits I manage because a couple of them are excitingly very accurate.

My theory is that the update seems to work best for people who are less mixed. Unfortunately, this doesn't bode well for most Americans since most of us are fairly mixed and come from multiple backgrounds. I believe this is why my report became less accurate with the update - I am a mixture of Italian, British, German, Norwegian, and a little bit Dutch and French. But my paternal grandfather, on the other hand, isn't very mixed at all. He's basically around 60% German and 40% Scottish or Scots-Irish, and although his results don't exactly match his tree, the new update is much more accurate than it was before.

My paternal grandfather's original AncestryDNA ethnicity
His original results (also see image right):
Great Britain 67% (range 43-87%)
Europe West 15% (range 0-35%)
Caucasus 10% (range 5-16%)
(Low Confidence Regions)
Italy/Greece 5% (range 0-14%)
Scandinavia 1% (range 0-7%)
European Jewish 1% (range 0-4%)
Iberian Peninsula < 1% (range 0-4%)
Europe East < 1% (range 0-3%)

With the update (also see map above):
England, Wales & Northwestern Europe 67% (range 62-100%)
Germanic Europe 23% (range 22-23%)
France 6% (range 0-9%)
Ireland and Scotland 4% (range 0-5%)

Remember, as I pointed out before, even though the category is now called "England, Wales, & Northwestern Europe, it covers the same area as before, including Scotland. The update is still leaning more towards his British background when his tree suggests he is more German, but the loss of all those low percentages in regions that didn't match his tree make it much more accurate than before. They also eliminated the unexpected 10% Caucasus, which wasn't even a low confidence estimate and so simply dropping that has made it much more consistent with his tree. Also, keep in mind that while we inherit 50% from each parent, we do not inherit exactly 25% from each grandparent, or 12.5% from each great grandparent, etc. So when I say my grandfather's tree suggests he's 60% German and 40% Scottish, that is very much an estimate because it's based on simply dividing each generation by half, which isn't actually how inheritance works. It's entirely possible he inherited more DNA from his Scottish ancestors than his German ones, even though he had more German ancestors than Scottish, and therefore the lean towards British over German in his ethnicity report could be entirely accurate.

My paternal grandfather's new AncestryDNA ethnicity
You may notice something weird about his new ranges though. As far as I know, they are still calculated by running 40 different analyses and than averaging out the results to get your final percentage, with the range showing the lowest and highest scores you got out of those 40 analyses. For England/Wales, my grandfather's range is as high as 100%, but that means every other category must have a range as low as 0%, and they don't. For Germanic, his range is 22-23%. It seems as though AncestryDNA are excluding the 0% in Germanic as an outlier - which I wouldn't have a problem with, but if they are going to do that, it means they should also be excluding the 100% England/Wales outlier too. Granted, it is still supposed to be in beta mode, so this could change as they continue to tweak things.

My husband is even less mixed than my grandfather. He is from England, born and raised, with a Catholic Irish father and Protestant English mother (which apparently caused quite the problem in their family when they married). On his mother's side, he actually has a Scottish branch and another Irish branch if you go back far enough, so he's about 60% Irish/Scottish and 40% English, and of course 100% British Isles.

Husband's update and comparison with old report
Here's his old results:
Ireland/Scotland/Wales 67% (range 50% - 79%)
Scandinavia 12% (range 0% - 27%)
Europe South 9% (range 1% - 16%)
Europe West 6% (range 0% - 23%)
Low Confidence Regions:
Iberian Peninsula 5% (range 0% - 13%)
Great Britain 1% (range 0% - 8%)

And with the new update:
Ireland and Scotland 61% (range 45% - 76%)
England and Wales 38% (range 34% - 38%)
Benin Togo 1% (range 0% - 1%)

Wow! Apart from that weird 1% in Africa, which is obviously just noise, the new results are almost exactly what his tree says and support the idea that the less mixed you are, the more accurate the update may be for you.

Here again, were seeing inconsistencies with the ranges. How can one category range by 31% when the only other two categories only range by 1% and 4%? In order to have gotten 45% as the lowest score for Ireland/Scotland, the rest of his categories must have added up to 55% to make 100%, but neither of them have that high of a result as their maximum in the range. This again suggests that they are sometimes excluding outliers, but oddly aren't doing it consistently. I will be eager to see more details when they finally release them. Understandably, they have not given us much information (none at all, really) on their methods for the update because it's still in beta mode.

Dad's update and comparison with old report
My dad's new results are aren't quite as accurate because he's still seeing a number of low percentages in various regions. His background isn't hugely mixed, but is 50% Italian, and his other half is about 30% German and 20% British (again, Scottish/Scots-Irish).

Previously:
Italy/Greece 44% (range 31-55%)
Europe West 19% (range 0-43%)
Great Britain 15% (range 0-35%)
Ireland 7% (range 0-19%)
Low Confidence Regions:
Middle East 5% (range 0-10%)
Scandinavia 4% (range 0-16%)
Caucasus 4% (range 0-10%)
Finland/Northwest Russia 1% (range 0-5%)
Asia South < 1% (range 0-2%)

Updated:
Italy 44% (range 43-58%)
England and Wales 24% (range 23-24%)
France 12% (range 0-13%)
Ireland and Scotland 10% (range 0-10%)
Germanic Europe 3% (range 0-27%)
Greece and The Balkans 3% (range 0-3%)
Sweden 2% (range 0-2%)
Turkey and the Caucasus 2% (range 0-2%)

It's good to see his Italian/Southern Europe results didn't change, considering mine changed so drastically (and wrongly). His are still 44% and now narrowed down to Italy, not just Europe South. And the 24% England/Wales is fairly accurate too considering, again, that despite the name it does primarily include Scotland as well. But they did fail to identify much German and he's still getting several noise-level results. Noteworthy though is the fact that if they were still using the old low confidence regions, everything apart from Italy, England/Wales, and Germanic Europe would be in low confidence, which is consistent with his tree. The criteria for it is described as:

"When an ethnicity has a range that includes zero (meaning that in at least one of the 40 tests, that ethnicity didn’t appear) and doesn’t exceed 15%, or when the predicted percentage is less than 4.5%, the ethnicity is included in an estimate as a low confidence region." - Full article here

So despite his low average for Germanic, the range is as high as 27% and that would be above the criteria for the low confidence regions. Looking at it that way, his new results for mainly Italy, England/Wales, and Germanic are actually kind of accurate.

My mom's previous AncestryDNA ethnicity report
Lastly, we come to my mom's new results. Her background is more mixed than my dad's, so it's not surprising that her update isn't quite as accurate. She is approximately 50% British (English and Scots-Irish), 25% Norwegian, 20% German/Swiss, and possibly a tiny 2-3% Dutch and 2-3% French.

Her previous results (show left):
Great Britain 46% (range 10-81%)
Scandinavia 29% (range 2-57%)
Europe West 16% (range 0-44%)
Ireland 4% (range 0-14%)
Italy/Greece 3% (range 0-8%)
Iberian Peninsula 2% (range 0-7%)

With the update (shown below):
England, Wales & Northwestern Europe 45% (range 43-52%)
Norway 40% (range 38-40%)
Ireland and Scotland 11% (range 0-12%)
Sweden 4% (range 0-4%)

My mom's new AncestryDNA ethnicity report
Her British results haven't changed much, but her Norwegian/Scandinavian results are now much, much higher than before, a drastic deviation from the fact that she only had one Norwegian grandparent. While the amounts we inherit from a grandparent may vary, it's unlikely to be as high as 40%, much less 44% if you add in the Swedish results. But most importantly, where did her German ancestry go? The update definitely seem to be underestimating German results in general, at least for my family. At least my dad got small results in Germanic - but none at all for my mom?

The ranges are generally smaller than they used to be, which suggests better confidence or more consistency in the results, but is that because in some cases, they are excluding outliers? Hard to say until we get more information on their methodology.

Monday, February 19, 2018

LivingDNA Review

LivingDNA are a British DNA company providing an ethnicity report (autosomal DNA) and a Y-DNA haplogroup (if you're male), and mtDNA haplogroup, for $159 (sales as low as $89 are periodic though). It does not include matching with other testers, although the company says this will be coming in the future, for autosomal DNA (I suspect they're trying to build up their database of testers first). They do offer a way to upload your raw data from other companies for free, however, it's well hidden and hard to find on their site (you can access it here), you won't get your results until August 2018, and it's unclear what the results will include.

UPDATE: They now make the upload easy to find with a new link (the previous URL to apply for their "research" is still available though) and have published some details of the results you'll get. The free upload will include DNA matching with other LivingDNA participants (called Family Networks), and the option to upgrade (for an undisclosed fee) for an ethnicity report. The option to upload will end October 31, 2018, so you need to hurry if you want to be a part of this. It sounds as though they are allowing uploads for the time being primarily to bulk up their database for the roll out of Family Networks.

As a British company, they have focused greatly on British DNA and offer the most breakdown available for this region than any other company at the moment. They also offer the most breakdown for Europe, the Middle East, Native America, and parts of Asia, but they are oddly lacking in any Jewish populations, and their breakdown for Africa and Oceania is fairly average. You can compare their breakdown of populations to other companies here.

But just how accurate are these more specific breakdowns? It's important to remember all DNA ethnicity reports are only an estimate, and in my experience, the more specific the regions are, the more speculative it is. It's difficult to say just how accurate the specifics at LivingDNA are. Of the known locations my British branches have come from, they include: Lancashire, Kent, Scotland, Hertfordshire, Essex, and Suffolk. However, there's probably other locations I don't know about, plus, DNA can go back further than my tree. My LivingDNA results within Great Britain include the
following (also shown on map below):
My regions of Britain and Ireland from LivingDNA
  • South England 8%
  • East Anglia 6.6%
  • Northumbria 6.2%
  • Southeast England 3.8%
  • Central England 3.6%
  • South Central England 2.7%
  • Lincolnshire 2.7%
  • North Yorkshire 2.7%
  • Devon 1.5%
  • Northwest Scotland 1.5%
  • South Wales 1.5%

This is not representative of Lancashire, but it does cover my other known regions, and then some. Unfortunately, Lancashire is my most recent English branch (immigrated in the mid 1800s), so you'd think I'd have more of that than anything, whereas the other areas are from colonial times. Again, it's difficult to say how accurate this may be given that DNA can be more representative of about 1000 years ago, while my tree has only been researched as far back as about a few hundred years. Additionally, given the small percentages, it's entirely possible some of these are just attributed to noise (like a false positive).

What is very consistent with my family tree is that the only result in Ireland I get is actually a part of Northwest Scotland (Scots-Irish). Despite having a couple "Mc's" in my tree, they are all Scots-Irish, not Irish. Also, the total amount of 40.6% in Great Britain & Ireland is very consistent with my known ancestry. I estimate from what I can that my tree is approximately 35% British. Other reviews have been saying that LivingDNA tends to overestimate their total British results, so I was pleasantly surprised to see mine were fairly accurate.

What about the rest of Europe? Here's the results:
  • Europe (South) 30.2%
    • North Italy 17.3%
    • Tuscany 10.4%
    • Aegean 2.5%
  • Europe (North and West) 27.8%
    • Germanic 17.1%
    • Scandinavia 10.6%
  • Europe (East) 1.4% (on "Standard" setting, this is unassigned)
    • East Balkans 1.4%
My Europe South regions from LivingDNA

A total of 30.2% in Southern Europe is somewhat consistent with my tree (I had one Italian grandparent, so 25% on paper), but interestingly it's in almost exact agreement with most other companies. AncestryDNA says 31%, FamilyTreeDNA says 33%, and 23andMe says 29.5%. MyHeritage are the only outliers with 41.6% (which is one of the reasons I feel MyHeritage are the worst for ethnicity). However, looking at LivingDNA's breakdown for it, this is not really consistent with my tree. Most of my Italian branches have been researched back to the 1700s, and they are all from Southern Italy or Sicily, primarily three towns: Monteroduni, Sulmona, and Polizzi Generosa. LivingDNA has my results mainly in upper and mid Italy. You could possibly argue that Monteroduni and Sulmona are right on the boarder of the region they are calling "Tuscany" (the middle portion in pink on the map above/right), but certainly, Polizzi Generosa (Sicily) is not highlighted at all. Granted, the southern tip of Italy is highlighted as a part of the "Aegean" region, but I only get 2.5% in this category. Populations charts (example below) frequently show how North Italy and South Italy are genetically very different, so for my largest results in Italy to be in North Italy when my Italian ancestry is from Southern Italy just doesn't seem right. The entire Italian side of my family are dark haired, dark eyed, with olive toned skin. We are definitely Southern, and that is disappointingly not shown in LivingDNA's results.

Population chart from AncestryDNA - the closer the dots,
the more genetically similar (note the dots for Italy
show two groups, the larger one is northern Italy,
the smaller one is southern Italy,  showing
how genetically different they are)
Next we have a total of 27.8% in North & West Europe, with 17.1% Germanic and 10.6% Scandinavia. This could just be a coincidence, but if not, then a big congratulations is in order to LivingDNA, because they are pretty much the first company to accurately tell my British, Germanic, and Scandinavian DNA apart from one another. Every other company jumps from one extreme to another, or plays it safe by lumping a large portion of my DNA into a "broadly" Northwest European category, unable to break it down further (23andMe). According to my tree, I should be about 25% Germanic (Western Europe) and 12.5% Norwegian (Scandinavian). At other companies, Western Europe ranges from 0% to 17.9%, and Scandinavia ranges from 0% to 12.3%. While the upper ends of these ranges seem on par with LivingDNA, it is always at the expense of the other group (i.e., 12.3% in Scandinavia means 0% in Western Europe). If you're interested, you can see my complete results from all different companies here (although I did not include the sub-regions of Britain, there were too many). It's a shame Germany and Scandinavia can't be broken down further like Great Britain or even Italy are, but hopefully that will change in the future. I'll look forward to seeing how accurate it may be. I also note that LivingDNA was able to accurately tell Germany apart from France, something no other company has even attempted to do.

Lastly, we have the tiny 1.4% East Europe, which they're putting in more specifically in East Balkans (although the map coverage is the same for both). I have no known Eastern European or Balkans ancestry, but it's worth noting that in "Standard" mode, this 1.4% becomes "unassigned". So they are obviously unsure about this, and therefore it's likely just noise.

Similar to 23andMe, LivingDNA provides several levels of speculation or specification for your ethnicity results. There are three modes: Complete, Standard, and Cautious. Complete attempts to identify any "unassigned" DNA found in Standard mode. There was very little difference for me, which is why I used Complete mode here. As I mentioned, there was the 1.4% unassigned which got put in Europe East, and then there was 3% unassigned under Great Britain and Ireland which got put into the 1.5% Devon and 1.5% Northwest Scotland. Cautious mode groups regions more broadly (see below). Within each mode, there is an option to view results on a Global scale, Regional, or Sub-Regional. At Global, I'm 100% European on every mode. This is a little bit contrary to other companies, which often give me at least trace amounts of Middle East, North Africa, or South Asia. 

My results in Cautious mode
In Cautious mode, these are my Regional/Sub-regional results (also shown on map to the right):
  • Great Britain and Ireland 40.6%
    • Southeast England-related ancestry 18.2%
    • North Yorkshire-related ancestry 11.7%
    • East Anglia 6.6%
    • South Wales-related ancestry 1.2%
    • Great Britain and Ireland (unassigned) 3%
  • Northwestern Europe-related ancestry 27.8%
  • Pannonian Cluster-related ancestry 19.8%
  • South Italy-related ancestry 10.4%
  • Europe (unassigned) 1.4%

It's interesting to note that in Cautious mode, there is a 10.4% in "South Italy-related ancestry". It's not a very high amount, but it's interesting that it swapped from North Italy to South Italy for some reason. Meanwhile, my Scandinavian results have strangely disappeared completely. The map above is showing how some areas are found in more than one category. So the grayish blob over Germany is gray because it's in both "Northwestern Europe" and "Pannonian Cluster". Likewise, the brown parts of Britain are brown because they are in both "Great Britain & Ireland" and "Northwestern Europe". These results are more comparable with how other companies group their categories. That doesn't necessarily make it more accurate, just more broad.

My mtDNA haplogroup migration map from LivingDNA
As for the Y and mtDNA haplogroups, I am female so I have no Y haplogroup, and my mtDNA haplogroup is consistent with 23andMe and FTDNA's Full Sequence test: T2b. No revelations there. It includes a written history of the haplogroup, a coverage map, showing countries where your haplogroup is most commonly found, a migration map showing the route your haplogroup took out of Africa, and finally a Phylogenetic tree showing how your haplogroup descends from Mitochondrial Eve (or Y Chromosomal Adam). In comparison, 23andMe only offers the written history, the migration map, and the Phylogenetic tree, no coverage/frequency map. Also noteworthy, while 23andMe and LivingDNA include roughly the same amount of mtDNA raw data (23andMe includes 4,318 mtDNA SNPs, while LivingDNA includes more than 4,000), LivingDNA includes significantly more Y-DNA SNPs (roughly 20,000 to 23andMe's 3,733). Of course, neither of them include mtDNA or Y-DNA matches, so if that's what you're looking for, you'd have to take FTDNA's dedicated tests.

LivingDNA also provides a very detailed, interactive display of your results to share with others. Here's mine. While other companies often provide a similar way of sharing your results, none that I've seen have been quite this detailed or interactive. Does it share too much? LivingDNA also allows you to control what you share by giving you the option to remove elements or widgets.

I was hesitant to test with LivingDNA, given their lack of DNA matching, and the higher price tag, I felt like what you got wasn't worth that much money. Then it was on super sale over Christmas so I decided to take the plunge. I am pleased with the ethnicity report - at regional level, it's been the most accurate for me so far, but the sub-regional results need some work. Particularly if you already know your haplogroups, I wouldn't pay full price for this test, but I do think it's worth exploring, especially if they add DNA matches in the future. 

Wednesday, January 17, 2018

Gencove Review

Some of the apps Gencove offer
UPDATE: Gencove no longer accept uploads from other companies.

Gencove sells DNA tests for $59.99, but they also offer a free upload of your raw DNA data if you tested elsewhere. With the free upload, you get all the same options you do if you tested with them, namely an ethnicity report and matching with DNA relatives.

They also offer "apps", some from third parties. There is even a Promethease app for $10, though it would be cheaper and probably easier to just upload directly to Promethease (see a full review of Promethease here). There's also an app for GenePlaza, which was also previously reviewed here. Though the app is free, GenePlaza's reports each cost a small fee. Clicking on the GenePlaza app in Gencove merely takes you to GenePlaza's website. The other apps are free too, but they aren't particularly useful. They include:
  • Discover your microbiome - Bacteria and viruses that live in your mouth
  • My Genome - Info about your genomic data
  • Sleep - Are you a morning or evening person?
  • iobio.io - Compare your genome to ClinVar
  • YouGenomics India - Help improve genomics for South Asia
  • Gencove Mobile App - Compare results with friends on iOS or Android
  • Open Humans - Contribute to research and citizen science

When I tried Microbiome it simply said "Microbiome not available" with no explanation as to why, so that was totally useless.

My Genome is just that - it's where you find your raw DNA data. You can download your raw data, you can view which apps on Gencove you've given permission to access your data, and you can view and manage your consent to participate in research.

The Sleep app is interesting but the results claimed I'm a morning person, which I have never been. The app asks you a few questions about your sleep habits before showing your results and it did note "It seems that the genetic score and questionnaire results don’t match - an interesting outlier! That's probably because the genetics of sleep is not very well understood yet."

iobio
The iobio app loads your DNA to gene.iobio.io which is a little bit of a technical app that will tell you if you have any variants of certain medically related genes. For example, it includes a report on BRCA1 and BRCA2, which are genes associated with breast and ovarian cancer. Despite the technical looking nature of the site, it will tell you, in plain English, if you carry any variants of the genes included in the report or not. Hovering over each gene will pop up a brief summary of what it is associated it. Most of them are likely somewhat rare, since I had no variants for any of them. There are 40 in total: PTEN, BRCA1, BRCA2, TP53, STK11, MLH1, MSH2, MSH6, PMS2, APC, MUTYH, VHL, MEN1, RET, RB1, SDHD, SDHAF2, SDHC, SDHB, TSC1, TSC2, WT1, NF2, COL3A1, FBN1, TGFBR1, TGFBR2, SMAD3, ACTA2, MYH11, MYBPC3, MYH7, TNNT2, TNNI3, TPM1, MYL3, ACTC1, PRKAG2, GLA, MYL2, LMNA, RYR2, PKP2, DSP, DSC2, TMEM43, DSG2, KCNQ1, KCNH2, SCN5A, LDLR, APOB, PCSK9, RYR1, CACNA1S, ATP7B, BMPR1A, SMAD4, OTC. If you have reason to check on any of these and want a quick, free way to do this, this is a good option, but it can also be easily accessed independently of Gencove, just go to http://iobio.io, however, it's not very user friendly and I couldn't find a way to upload my data, so going through Gencove may actually be the better option.

YouGenomics India, recently renamed "Genavli Biotech", is a research project for South Asia, attempting to improve ethnicity reports for people with South Asian ancestry. Naturally, it wouldn't be useful for anyone who is not South Asian but if you are, you should look into this. As far as I can tell, Gencove's app simply links to the YouGenomics India website.

The Gencove Mobile App doesn't really offer anything that the website doesn't apart from some surveys which I presume are for research purposes. It allows your to see your ethnicity report and the unavailable microbiome report, and connect with or invite your friends. That's about it. 

The Open Humans app merely takes you to openhumans.org, which is an open research project. Gencove does not load your data there, so there's really no need to go through Gencove if you wish to participate in this project.

Gencove's populations for their ethnicity report
Most people will likely be most interested in the ethnicity report. There are 26 populations available, some of them are broad, large regions, while others only cover a small region. They include: Northern and Central Europe, Northern Italy, Northern British Isles, Southwestern Europe, Middle East, Eastern Mediterranean, Bengal, Central Africa, Eastern Africa, Northern Africa, Central Indian subcontinent, Southern Indian subcontinent, Oceania, Southeast Asia, Northeast Asia, Anatolia-Caucasus-Iranian Plateau, Central Asia, East Asia, North-central Asia, Northeast Europe, Scandinavia, Finland, Southern Africa, Western Africa, Ashkenazi Jewish, Americas. A map showing what these populations cover is shown left/above.

My personal results were not particular accurate, although I did note that if I added together all my results in populations probably associated with my Italian ancestry versus those from my Northwest European ancestry, the numbers were consistent with what most other companies say. Here are my Gencove results:

My Gencove ethnicity report
48% Northern and Central Europe
21% Northern Italy
15% Northern British Isles
7% Southwestern Europe
6% Middle East
3% Eastern Mediterranean

My Italian ancestry is southern, not northern, but if you add up the results for Northern Italy, Southwestern Europe, Middle East, and Eastern Mediterranean, you get 37%, which is very similar to the 36% from AncestryDNA and 38% from FTDNA. While my results in more specific regions may be all over the place across different companies, the divide between northern Europe and southern seems very distinct with me so when an ethnicity report is consistent with that, I know there's at least some reliability to it. 

Lastly, Gencove offer the "Relative Radar" which finds people you share DNA with. Unfortunately, there must not be very many testers/uploaders in their database because it found none for me so all I can say about it is that it seems to use a visual display, plotting relatives who share more DNA with you closer to your profile icon.

Conclusion: Since it's free, there's really no harm in checking out Gencove (unless you have concerns about research participation). Because some of their "apps" simply link to other sites, it looks like they offer more than they really do. The ethnicity report, sleep app, and iobio data were the only really interesting or useful options, but even with those, don't expect too much. I definitely wouldn't pay $59.99 to test with them, although the low price point in comparison with other testing companies may be appealing, you would get more out of your money by testing with AncestryDNA or 23andMe and then uploading to Gencove for free.