Showing posts with label dna. Show all posts

Saturday, September 24, 2022

Eurogenes K13 Charts and Maps

I know for many people like myself who are visual people, seeing a map of where exactly each region covers can be really beneficial to understanding your Gedmatch Admixture results. There's already some official European maps available for Eurogenes EUtest V2 K15 from the Eurogenes blog, and you can sometimes find some unofficial ones for other calculators, but I haven't seen any for Eurogenes K13, so I gave it my best shot.

Anyone can make these maps with the right tools - the data is readily available from the Population Spreadsheets for each calculator. The difficult part is that the tool I used to create the map was in Google Spreadsheets Charts, which only recognizes modern country names. So I had to categorize every specific population into a modern country. Not easy considering many countries included several populations (I simply averaged them) and many of the populations span several countries (I just put the data in all relevant countries). But still, it wasn't easy, so it's safe to say these are very much unofficial maps, not endorsed by the Eurogenes creator. They are interactive, so hover over each region for the percentage. If anyone can recommend a better free mapping program, please let me know!

K13 North Atlantic Map - essentially a "Northwest Europe" region primarily including British Isles, Scandinavia, and Germanic Europe, though as you can see, it also includes most of Europe to some degree.

K13 Baltic Map - primarily the Baltic States (though data is missing for Latvia) and surrounding areas, though again, you can see most of Europe is included to some degree.

K13 West Med Map - primarily areas that border the western portion of the Mediterranean Sea (both Europe and North Africa), also including the eastern portion of the Mediterranean area to a lesser degree.

K13 West Asian Map - peaks in the Caucasus region, includes surrounding areas (does not include all of Russia, there's just no way to break down the maps more).

K13 East Med Map - primarily areas bordering the eastern portion of the Mediterranean Sea (leaning more heavily to the North African and Middle Eastern areas), though it appears to peak in Yemen, that's due to the Yemen Jewish sample getting the highest results in this category.

K13 Red Sea Map - mainly be areas bordering the Red Sea, though data in some African areas is missing, it peaks in the Arabian Peninsula and Horn of Africa, yet also includes all of North African to some degree.

K13 South Asian Map - peaks in India, Bangladesh, Nepal, and Pakistan, including surrounding areas in varying degrees.

K13 East Asian Map -coming soon.

K13 Siberian Map - coming soon.

K13 Amerindian Map - coming soon.

K13 Oceanian Map - coming soon.

K13 Northeast African Map - coming soon.

K13 Sub-Saharan Map - the area south of the Saharan desert, peaking in West Africa and Bantu regions, but also covering parts of North Africa to a much lesser degree. Data for some areas is missing.

I also created charts showing what percentage each sample population got for each region, so you can get an idea of what each region includes even for the areas I haven't done maps for yet:

K13 Population Chart (by population)

Despite having done all this, I do want to clarify that Gedmatch's Admixture calculators have not been updated in many years, and the reference panels used for them are very small in comparison to the consumer testing companies, so you should definitely take the results with a large grain of salt.

Wednesday, July 20, 2022

A Chromosome Painter Comparison

Recently AncestryDNA added yet another feature to their DNA tools, a Chromosome Painter. It shows us which portions of our chromosomes they have identified as coming from which regions. It's found under SideView because there's also a breakdown by Parent 1 and 2. AncestryDNA joins 23andMe and FamilyTreeDNA in offering this feature (leaving MyHeritage as the odd man out), so I decided it was time to compare them.

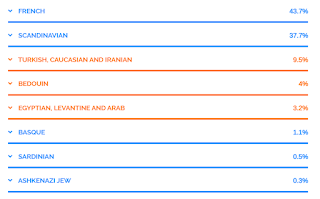
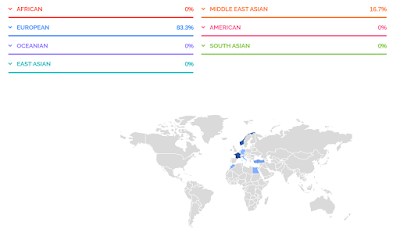
For me, it's easiest to analyze my Italian ancestry since it's genetically more distinct from the rest of my ancestry which is Northwest European. At Ancestry, it's mostly identified correctly as Southern Italy (22%), and some as Northern Italy (9%). At 23andMe, it's primarily put into Italy (23.6%), with a little bit in Greece/Balkans (1.6%), Cyprus (3.2%), and Anatolia (1.6%). A few other less than 1% results in various Southern Europe/West Asia areas add up to only 1.2%. FamilyTreeDNA isn't quite as accurate, but at least they get most of it in Southern Europe, with 28% in Greece/Balkans and only 8% in the Italian Peninsula. However, as you can see, the totals add up to approximately the same amounts at each company: 31% at AncestryDNA, 31.2% at 23andMe, and 36% at FTDNA. This is consistent with the fact that my paternal grandmother was Italian and since my paternal grandfather tested, I know I share 18-19% (depending on the company) with him, leaving 31-32% I obviously got from my Italian grandmother (totaling the 50% from my dad).

Knowing that the percentages are fairly consistent, I wanted to see if the individual segments identified in these regions would be consistent across all companies as well. Overall, there was reasonable consistency between 23andMe and AncestryDNA, but FTDNA was all over the place. Let's look at it chromosome by chromosome, at least on a few of them (I don't think I need to go over all 22 of them).

Chromosome 1

AncestryDNA shows almost the full length of one side of chromosome 1 is Southern Italian (above), apart from a small portion at the end. 23andMe shows the first and last portions of the chromosome as Italian (below, first), with the middle bit missing, but interestingly, it seems at least some of that middle bit is identified as Cypriot (below, second).


Obviously, there's some overlap there and it's saying they're on opposite sides, but there's no way either Italian or Cypriot is coming from my mom's side since she is 100% Northwest European - British, German, Norwegian. So although it may not align perfectly, it does seem to suggest nearly the full length is coming from Italy/Cyprus, which is mostly consistent with AncestryDNA.


Unfortunately, FTDNA isn't as consistent with the other two companies. As you can see (above), the Southern European (light blue) portions are much more broken up, although I suppose one side does seem to be be mostly Southern European. The dark blue portions are Western European, FTDNA's chromosome painting doesn't offer any more breakdown than that and doesn't allow me to isolate the different regions in the visual.

Chromosome 2

On chromosome 2, AncestryDNA (below, first) and 23andMe (below, second) are almost exactly the same. They both put essentially the entire length of one side of the chromosome in Italy (Northern Italy at AncestryDNA), though there's a tiny sliver at the end at 23andMe which they deemed Broadly NW European, that's probably not a significant amount.


But here again, at FTDNA, the results are so inconsistent that it almost seems random (below).


Although one side has more Southern European (light blue) than the other, it's so broken up and looks so similar to chromosome 1, it just doesn't seem very reliable.

Chromosome 3

The results on chromosome 3 are exactly the same at AncestryDNA (below, first) and 23andMe (below, second), while FTDNA (below, third) is once again not as consistent.


I suppose FTDNA has a little more solid light blue than previous chromosomes, but it's not the full, unbroken length we see at AncestryDNA and 23andMe. That little sliver of green is Middle East.

Chromosome 4

This one is also very consistent between AncestryDNA and 23andMe, but for the opposite reason - both companies say no portion of either side of chromosome 4 comes from anywhere in Southern Europe or West Asia. Here we can analyze some of my Northwest European ancestry a little bit. 23andMe (below, second) says both sides of the chromosome are NW European, primarily from France/Germany (light blue), with smaller portions unable to narrow down and identified as Broadly NW European (grey/missing portions). At AncestryDNA (below, first), the entire length of one side is identified as Scottish (lime green), and the full length of the other side is categorized as Norwegian (light blue). This is extremely consistent with my known ancestry - my paternal grandfather was mostly German and Scottish, while my mom is part Norwegian. 23andMe only gives me a small percentage of Scandinavia though, with none of it on chromosome 4. None of this surprises me, since British, Germanic, and Scandinavian have a lot of genetic overlap and are difficult to tell apart, so who knows which company is right, but at least they both agree that both sides of chromosome 4 are NW European.


Not so much with FTDNA (below). Although they do identify most of both sides as Western Europe (dark blue), there are still portions of Southern Europe (light blue) seemingly randomly thrown in there.


At this point, it doesn't even seem worth carrying on comparing FTDNA. The rest of every chromosome is pretty much the same as what I've already shown here. Although the amounts of Western vs Southern Europe vary somewhat in vague keeping with the other two companies, the minimal variation is not worth going into a detailed comparison.

Chromosome 8

I want to skip ahead now to chromosome 8. Chromosomes 5, 6, and 7 are exactly the same at both AncestryDNA and 23andMe - both companies identified the exact same portions as either Italian or Southern European. Chromosome 8 is the first time we really see a significant difference in what the two companies report.


AncestryDNA (above, first) estimates that roughly the second half of one side of chromosome 8 is from Southern Italy (teal), while the first half is Scottish (lime green), and the other side is supposedly from Sweden/Denmark (pink). I don't have any ancestry from Sweden or Denmark, and AncestryDNA puts my combined Scandinavian percentage a little high, and my Germanic a little low, so I'm assuming it's probably coming from my German ancestry.

However, 23andMe (above, second) doesn't identify any Italian or Southern European (or West Asian, for that matter) on chromosome 8 at all. It estimates one side is entirely French/German (light blue), and the rest (grey) is mostly Broadly NW European with a small portion in Scandinavia.

So the portion AncestryDNA deems Italian, 23andMe says is Germanic.

Chromosomes 9-22

The rest of my chromosomes probably aren't worth going into visual detail, but here's a quick summary:

Chromosome 9 - AncestryDNA estimates the full length of one side is Northern Italian while 23andMe says only half of that side is Italian/Southern European.
Chromosome 10 - AncestryDNA claims about the first third of one side is Southern Italian, but 23andMe puts that portion (which is more like the first half of the chromosome) in Cyprus.
Chromosome 11 - AncestryDNA puts the full length of one side in Northern Italy, and 23andMe says most of that is Anatolian.
Chromosome 12 - AncestryDNA reports no Italian ancestry at all, but 23andMe says about half of one side is Italian.
Chromosome 13 - Again, nothing Italian from AncestryDNA and this time, 23andMe agrees (nothing from Southern Europe of West Asia).
Chromosome 14 - Ancestry estimates the full (tested) length of one side is Southern Italian. 23andMe says most of one side is either Italian or Arab/Egyptian/Levantine.
Chromosome 15 and 16 - Both companies agree the full (tested) length of one side is from Italy (specifically Southern Italy at AncestryDNA).
Chromosome 17 and 18 - Both companies agree there's no sign of Southern European or West Asian ancestry at all.
Chromosomes 19, 20, 21 - Both companies agree the full (tested) length of one side is from Italy (specifically Southern Italy at AncestryDNA).
Chromosome 22 - Both companies agree the full (tested) length of one side is from Italy (specifically Northern Italy at AncestryDNA).

Although there's some variations on a few chromosomes, overall I'd say the AncestryDNA and 23andMe are very consistent with each other. FTDNA was so inconsistent I literally gave up comparing it.

Here it's worth noting that 23andMe include ethnicity on the X chromosome where neither AncestryDNA or FTDNA do. To my knowledge, 23andMe are the only ones to use the X chromosome for ethnicity, though admittedly I don't know about MyHeritage since they neither offer a white paper or a chromosome painter. At 23andMe, it identifies one side of my X chromosome as French/German (my mom's side) and the other side as mostly Italian (dark blue) from my dad's Italian mother. The small portion at the end of that side is classed as Broadly Northwest European (lightest blue).

For the record, X-DNA makes up only about 5% of all your chromosomes. Some people point out that at 23andMe, a man's ethnicity report will include more DNA from his mother than his father because men only get X-DNA from their mother, not their father. Women get one X chromosome from their mother, one from their father, meaning it's still 50/50 just like with the autosomal chromosomes. Instead, men get one X chromosome from their mother and one Y chromosome from their father, but Y chromosomes aren't used for ethnicity (ever), so they will have slightly more DNA from their mother than their father on the ethnicity report. This is true, but it's worth noting that one X chromosome only amounts to about 2.5%, which is also within "noise" level amounts. So we're not talking about a significant or noteworthy difference. 

Wednesday, April 13, 2022

More Ethnicity Updates from AncestryDNA

AncestryDNA is maintaining their annual ethnicity updates, and it's a little early this year. But it's a new kind of update - rather than the usual changes to either the reference panel, or algorithms, or both, this one introduces a new feature called SideView. It is essentially phasing our DNA with our DNA matches to determine which ethnicities come from one parent or the other. It also means adjustments to our individual percentages, which should theoretically be an improvement. Phasing is usually done with parents or other very close family members, so I was skeptical about AncestryDNA doing it with our more distant matches. Your parents don't have to have tested for this new feature to work, but I was hopeful that my parents having tested would make it more accurate.

I find the parental breakdown (shown above) is very reliable - at least, it's as reliable as it can be given how accurate (or not) each of my kits are to begin with. For example, it correctly identified that my Norwegian and Italian ancestry are from opposite sides of my tree, and that is true: Norwegian is on my mom's side, Italian is on my dad's side. But it puts all of my Germanic ancestry on my dad's side because my mom's results still don't include Germanic despite having a great grandfather of full German descent (dozens of DNA matches on this branch confirm there's no NPE) and several other German branches further back. 

Looking at my mom's parental breakdown, shown above, (neither of her parents having tested), there is less reliability, that's partly due to the fact that her Norwegian ancestry is grossly exaggerated. She now gets a whopping 47% in Norway despite only having had one Norwegian (or Scandinavian) grandparent (so she should be about 25%, although it may vary, it shouldn't be more than about 36%). The majority of her Norwegian results does get put on one side, but that means there's not much room left for the other 25% on her mom's side that should be mostly English. Most of her English results get put on her other side, which isn't exactly wrong, she does have some English ancestry on that side too. But her dad's side should be mostly Germanic, and again, she gets no results in Germanic. If the percentages were more reliable to begin with, the split up would be more reliable too.

My dad's parental breakdown is very accurate, probably partly because his father tested but also because there is more genetic distinction between his mom and dad's sides - his mom was Italian, his dad mostly German and some Scottish and English. The split up (shown above) correctly shows all his Italian (Southern and Northern even though his ancestry is only Southern) plus trace amounts in Cyprus and Levant (obviously coming from his Italian ancestry) on one side, equaling exactly 50%. On the other side it correctly places all the rest of his ethnicities, although they are not all accurate - he wrongly gets results in Scandinavia where he has no known ancestry.

My paternal grandfather's parental breakdown is surprisingly very consistent with his tree, considering neither of his parents tested. On his paternal side, he is German with some English. On his maternal side, he's German and Scottish, with some English. Although his percentages are overall off (too much English, not enough German), the split up is accurately reflected here. English on both side, German on both sides (though barely), and Scottish on only one side.

My husband's parental breakdown (shown above) is also as accurate as possible given his percentage results and the fact that neither parent tested. It correctly identifies the majority of his Irish ancestry on one side and all of his English ancestry on the other side. His father was Irish, his mother was mostly English. He overall gets 40% in Ireland (a decrease from previous 47% which was much more accurate), and 36% is assigned to one side, his dad's side (shown below). His mother does have one Irish branch from much further back, which would amount to about 3%, and interestingly it puts 4% Ireland on his mom's side. Not bad. It then splits his Scottish results up more evenly on both sides - he does indeed have one Scottish 2nd great grandparent on his mother's side, so the Scottish portion being assigned to his father's side is obviously just due to the genetic overlap between Ireland and Scotland. His Scottish percentage is exaggerated to begin with: 22% when it should be more like 6% and probably no more than 12%, but interestingly the amount that is put on his mom's side is 9%, which is consistent with the Scottish 2nd great grandfather on his mom's side. Again, not bad, AncestryDNA, not bad. However, he has no Welsh or Norwegian ancestry, so those are obviously coming from genetic overlap with England.

So overall, the split ups among most of my kits were very reliable, but I can't say the percentages have benefited from the phasing. For example, my Scottish results wrongly shot up from 12% to 29% - based on my tree, the former is more accurate. And as mentioned, my mom is still lacking any Germanic results at all when she should be at least 12%, while her Norwegian results were already too high to begin with (43%) and just went up even more (47%). My dad's results didn't change by much, but he's now getting small percentages in incorrect regions that he didn't get before. In fact, most of my kits have seen this too - most of them now have small percentages in Ireland which they didn't have before. To my knowledge, all of my so-called "Irish" ancestors were actually Scots-Irish. So previous results were more accurate and the sudden appearance of Irish in results is disappointing (only because it's not accurate, not because there's anything wrong with being Irish, lol - obviously, my husband is half Irish).

Tuesday, February 1, 2022

TellMeGen Review

New DNA companies with the option to upload raw DNA data from other companies keep popping up, and honestly, it's hard to keep track of them. But recently, I tested one called TellMeGen out of curiosity. They offer reports on disease risk, traits, wellness, ethnicity, and even offer matching with other testers, all for free. But you know the saying, "you get what you pay for"? That's a little bit true here.

I can't really complain about the health and traits reports, they are easy to understand but also include the technical data if you want to explore that. They include reports on a lot of common health issues people want to know about, like cancer and heart problems. They correctly identified me as probably lactose intolerant, and having decreased levels of vitamin D. There aren't many Monogenic Diseases included, but that may just be because I uploaded from another company, so the data may not be there for some reports. It's always best to test with the company when they offer their own kit, but I can't afford to be buying all the DNA tests available out there.

But what we're focusing on is the ethnicity report, and I have to say it was not very consistent with my known ancestry at all.


 French 43.7%
 Scandinavian 37.7%
 Turkish, Caucasian and Iranian 9.5%
 Bedouin 4%
 Egyptian, Levantine and Arab 3.2%
 Basque 1.1%
 Sardinian 0.5%
 Ashkenazi Jew 0.3%

The only location/population here that's accurate is Scandinavian. I do have Norwegian ancestry, but it is not this high - more like 12.5% (one great grandparent), and other companies usually peg it even lower than that, suggesting I may have gotten than expected from my Norwegian great grandfather. I'm guessing that my inflated Scandinavian percentage includes my British ancestry, knowing there is genetic overlap between them.

I do have some very early colonial French Huguenot ancestry too, from the 1600s - but it amounts to less than 1% of my tree, so I do not consider it relevant to DNA ethnicity reports. Probably, the high amounts in France are coming from my neighboring Germanic ancestry.

Adding up the Middle Eastern results, I get 16.7%, which I can only imagine is coming from my Italian ancestry, though why it didn't come up Italian, I can't say. But even adding the Basque and Sardinian results in for 18.3%, it still doesn't add up to my expected amount of Italian ancestry, which I've detailed here many times as being about 32%. 

Although the 0.3% Ashkenazi is small enough to just be noise, knowing how endogamous the Ashkenazi population is and how reliable results in this category normally are, and should be, getting any results at all in this population when I have no known Jewish ancestry and get no results for it at any other company, is just another point against TellMeGen.

In short, my results simply do not make much sense. While it's not totally unreasonable to get some results in neighboring regions, this is a bit extreme, and if I have to jump through hoops to make sense of my results, it's not a reliable report.

Sunday, September 19, 2021

How to Group Your DNA Matches to Help Break Down Brick Walls

How do you break down a brick wall with DNA? It's what everyone wants to know - after all, what is the point of getting a DNA test if the ethnicity report is unreliable? Everyone says the true value of the test is in your DNA matches, but how do you utilize them to actually be useful in your research? To break down brick walls? To do what paper research couldn't?

This sort of ties in with my instructions on how to find unknown biological ancestors with DNA, though that was targeted more at NPE or adoption situations. However, the same basic process and workflow can be applied to breaking down brick walls. In the past, I've detailed specific cases where I've used DNA to break down a brick wall, but some of them are a little unique - every situation might be a little different, and therefore might require a bit of a different process. But here's the basics. 

In my post about finding unknown biological ancestors, in Step 1, it says, "Look for your closest DNA match that you can't identify as being from another known branch of your tree."

But wait - how do we even get to the point of finding a match you can't identify? You do that by identifying and grouping as many matches as you can. This is how my workflow goes, it works best for me, your mileage may vary, but in my experience, this is how most people do it in some way or form. Some maybe use a spreadsheet and the "Leeds Method", but ultimately, it's just a matter of grouping your matches by what branch of your tree they belong to, and since AncestryDNA have a built in grouping tool, I find that works best for me.

Grouping your matches.

Step 1: Create a group for each "branch" of your tree. Which branches? I recommend a group for each of your sixteen 2nd great grandparents, unless any of those 2nd great grandparents were from the same specific location, or endogamous population, because they will be difficult to tell apart. For example, my 2nd great grandparents who both came from the same tiny town in Italy called Monteroduni got grouped together because I have no other branches from there, and since the town is so endogamous, it would be difficult to always tell them apart. So I just have one group for "Monteroduni". Don't group by broader locations, like country. I did that by grouping my other 2nd great grandparents together because they were both from Norway, but now I regret that because they came from totally different parts of Norway, so there's no endogamy between them. So although I recommend a group for each 2nd great grandparent, depending on your ancestry, you may want to sometimes group them differently. 

16 groups does mean that it will fill up a lot of your available groups, AncestryDNA only allows you a maximum of 24, so you will only have 8 groups left to do with whatever you want. So like I say, you may want to group them differently, but this is what worked best for me.

Step 2: Start at the top of your match list and work your way down. Do you recognize your top match? Or can you see from their tree (if they have one) what ancestor you share? Is there a ThruLines/common ancestor hint for them that you can verify? If you already know the match or can identify how you're related to them, mark the branch you share by adding them to a group you've created for that branch. Do not assume a shared surname alone is the source of your shared DNA, it must be an actual common ancestor.

You may also want to add a note of your common ancestors, so you can see who they are more easily, and also so you know there's identified common ancestors (though I also have a group for MRCA - matches that have identified a most recent common ancestor).

My top matches are all my Italian cousins, you can see how
I've grouped them and added our MRCA to notes


Step 3: Do the same for the next match, and the next - keep going until you can't identify a match. When that happens, look at your Shared Matches with that person. Are any of them the people you've already identified with a common ancestor? If so, they are likely also from the same branch (especially if there's more than one match they share from the same ancestor/branch), so add them to that same group. 

I don't know my MRCA with Bettye because she hasn't added a tree,
but I can tell she's from my Smith branch because she matches
several people who are confirmed Smith descendants

If they have a tree, even a tiny one, build on it until you can find the connection to the branch you know they are likely from (focus on lines that come from the same/nearby location). If you can't find a common ancestor, that's okay, leave them in that group and you can come back to them another time.

Step 4: Keep doing this, ideally for all your estimated 4th cousins and closer (20+ cM). That's a lot, I know (I currently have 1,048 matches that share 20+ cM with me). It takes time, it's a lot of work, but in the end you'll wind up with 3 types of matches: those with identified common ancestors, those who likely come from an identified branch, and those you have no clue how you're related, not even a potential branch.

What to do with these groups? 

This is where there will be some overlap in my instructions on finding an unknown biological ancestor. Look at the closest match that you haven't even been able to group into a certain likely branch (or a common ancestor). Even if they don't have a tree, that's okay - look at your Shared Matches with them and open any match that has a viable tree. Compare the trees - do any of them share an ancestor with each other that you don't recognize? If so, research that ancestor and build a tree for them, you may find it links up with yours somehow, maybe even by breaking down a brick wall, or that it leads to an NPE - when someone's parent(s) is/are not their biological parent(s).

Additionally, you can look at your closest match that you haven't identified a common ancestor with, but you have grouped them into a likely branch. If they have a tree, again, build on it, and keep researching until you can find a connection. See my case example of Emma Elizabeth Sherwood.

This method of grouping your matches to single out the ones you can't identify at all can help lead you to some enlightening revelations, but they tend to be rather random. You don't know what you're going to find, you don't know which brick wall it might break down. Even the matches you can group into a likely branch but you're still searching for the common ancestor might surprise you - in my example of Emma Elizabeth Sherwood (above), I knew the match was related to my Mills branch (Emma's husband), but I had no idea it would finally break down the Sherwood brick wall that had been blocking me for 12 years.

Other methods.

There's other methods of breaking down a brick wall with DNA, ones that are more targeted for a specific brick wall, but they heavily rely on the surname you're looking for not being a very common one. You basically just search your matches trees for the surname you're looking for, and then compare the trees of the matches in the results, looking for a common ancestor among them. It can work well when the name isn't common, because it's likely most of the matches in the results will be the ones you're looking for. But the more common the name is, the more matches there will be in the results that aren't related to the branch you're looking for. That's why this never worked with Emma Elizabeth Sherwood (in my above example), because Sherwood was too common of a surname, I only found her family by using the more random grouping method and not knowing where an unknown match would lead me.

The surname search method would be much more effective if AncestryDNA would offer a very simple feature: the option to search for a surname within a specific location. At the moment, you can search for a surname or location, but not a surname in a location. So you can search for Smith OR Christian County, Kentucky, and you can search for them both at the same time, but it will include results for match's trees that have either the surname Smith, OR the location Christian County, Kentucky. And even if the tree includes both, it's not necessarily for the same branch or ancestor, it might be their Jones branch that's from Christian County, Kentucky, while their Smith branch is from Pennsylvania. For common surnames, we need a way to narrow it down, and the best way to do that is by looking for surnames within a specific location. At the moment, we can only do that manually by searching for a surname, and going through each match in the results to see for ourselves if that branch is from the right location. If so, then we can look for a specific common ancestor. It's very time consuming, and the more common the surname is, the less realistic it is to go through all those matches manually, yet there's a very simple way to make it easier, if AncestryDNA would just listen to their customers.

The surname search works a lot better if it's not a common surname. I successfully used this method with the surname Deaves, and also a suspected maiden name of Brannin.

You can also search by just location, but this only really works if your ancestors are from a very small, unique town, especially where there's endogamy. In my above example about my 2nd great grandparents who came from a tiny Italian town called Monteroduni, it's safe to say that the town is so small and endogamous that anyone who has ancestry from Monteroduni is probably related. Certainly, any DNA match of mine that has ancestry from Monteroduni, it's safe to say that's very probably how we are related. So I can very easily search my matches trees for the location of Monteroduni and even if I can't find a common ancestor between us, most likely that's probably where our common ancestors were from. Brick walls are difficult with endogamy though, so that might be the most I'll ever be able to determine. Searching by location may not break down any brick walls in your tree, but it does help you identify and sort your matches into groups/branches, which can help you find other unknown matches that may lead to a brick wall.

Like I say, sometimes breaking down a brick wall with DNA can be unique to the situation. Sometimes you have to think about what you're looking for, and consider the best way to come at the problem. But this should give you the basics to get you started. Feel free to share your success stories!

Tuesday, September 7, 2021

ThruLines is not the enemy

I see a lot of skepticism out there about ThruLines, and some of it is warranted, because it is based on family trees, which can have errors that get copied multiple times. But that doesn't mean you should dismiss ThruLines entirely, there are ways to get reliable use out of it, and not just by finding records that confirm them. There are ways to use DNA to find biological relatives or break down brick walls in your tree even when there's no written records of the lineage, and ThruLines is just one tool that can help you do this.


It's basically a matter of probabilities. The more people you match who are descended from multiple siblings of your ancestor, especially when all those descendants all or mostly match each other to form a cluster, the less likely it becomes that it's an error. When the matches mostly all match each other to form a cluster, you know they are all related and descended from the same branch/ancestor - you just need to identify which branch/ancestor, which is where trees and ThruLines come in. Each sibling that those matches descend from would have to be an error for trees/ThruLines to be wrong, so the more siblings you match descendants of, the more likely the trees are accurate. If you match 20 people (who mostly all match each other too) descended from 5 siblings of your ancestor, what are the chances there's been an error in the trees for each of those 5 siblings, plus your own ancestor? Extremely unlikely. In the example above (click to enlarge), there's 41 matches descended from 8 siblings of Elizabeth Mertz, so for this all to be wrong, there would have to be 9 different errors. This amount of evidence is really very conclusive, and I can probably confirm this family now.

Even assuming there's only one error and those siblings are indeed siblings to each other, but your ancestor is the lone error, and not actually their sibling, what are the chances you would match that many people from a certain family, if you weren't related to that family somehow? Using the example above again, what are the chances I match 41 people descended from those 8 siblings, if Elizabeth Mertz is not one of their siblings? Again, it's very unlikely - and the only way this would be possible is if there was a lot of endogamy involved, but even so, it would still be pointing you towards a specific population you're likely descended from (and matching surnames from the same endogamous population means you're probably related to that specific family somehow), so you don't want to dismiss it.

Granted, it doesn't confirm who exactly the parents of those siblings are, only that they are indeed siblings. For that, you'd have to go up another generation and do the same thing - look for people descended from siblings of the alleged father and mother. In the example above, it doesn't really confirm that Phillip Mertz is the father of Elizabeth and all her siblings, only that they are siblings from the same parent(s), whoever that may be. But for now, it's probably safe to add Phillip Mertz at least as a placeholder until more research can be done (it really is okay to add speculative data to your tree as long as you know it's speculative!).

In the example below, you can see how this ThruLines doesn't confirm descent from Benjamin Butler - the 6 DNA matches are descendants of children of David Butler, so this really doesn't confirm this potential ancestor at all.

And there's other limitations, mainly the fact that the Shared Matches tool (which is the only way to confirm if matches match each other and form a cluster) only includes estimated 4th cousins or closer (20+ cM). AncestryDNA really need to provide something more comprehensive. They say it's limited to 20+ cM because it would tax the server too much if they expanded it to include all matches. But at the very least, they could expand it to 15+ cM segments, which have a 100% chance of being identical by descent. That would still exclude most matches (8-15 cM) and therefore not be as taxing on the server, but include all matches that have a 100% chance of being IBD, which would make ThruLines so much more useful and reliable. At the moment, they are excluding hundreds, even thousands of IBD matches from the Shared Matches tool, which is extremely debilitating. Alternately, they could offer another tool that would be less taxing on the server - a simple one-to-one comparison. Pop in two match usernames, which would tell us whether those two matches match each other or not. Very simple, not very taxing, but it would get the job done.

Even so, it's still possible to get reliable usage out of ThruLines. Remember, ThruLines is only automating a process that people used to manually do (and still do when the relationship exceeds ThruLines' 5th great grandparent limit). If it weren't possible to use DNA to confirm relationships when there is no written record of it available, what use would DNA be, and how do you think all these NPEs are being discovered? While it's true that you do have to watch out for tree errors being replicated in ThruLines, if you understand how DNA and ThruLines work, there is useful data you can get out of it. To often, I see people who seem to completely dismiss ThruLines, as though it's not reliable at all, but you're only hindering your own research by thinking that.

Tuesday, August 10, 2021

Finding Unknown Biological Ancestors with DNA

This is a topic that comes up regularly in genealogy circles, because DNA testing often reveals cases of unknown adoptions, or what we call "non-paternity events" (NPE), when someone's father is not their biological father. Once there's enough suggestion that something like this has happened, the question then becomes, how do I identify this unknown biological ancestor? It can be done, although the further back on your tree it occurred, the more difficult it will be (far enough back and it might not be possible). Whenever possible, it's best to have someone from the oldest generation descended from this event to test. Like if you're looking for Grandma's unknown biological father, have Grandma take the test, or if she is unable or unwilling, have your relevant parent take the test. At the same time, if the person you're looking for is actually still living (like if you're adopted and looking for living biological parents), it will be difficult to research since lots of records on living people are private (that's a whole different ballgame and you often have to rely more on information and communication from your DNA matches). Additionally, if you're working with an endogamous population, you may be out of luck. With all that in mind, here's how it works.

Step 1: Look for your closest DNA match that you can't identify as being from another known branch of your tree. If they don't have a family tree added, that's okay because first you want to look at their Shared Matches, and open any matches that do have family trees (the bigger, the better).

Step 2: Compare the family trees of those Shared Matches, looking for ancestors any two or more (the more, the better) of them have in common with each other (especially if those matches also match each other) - ancestors who are not found in your tree. Yes, this may take some time because you have to manually compare the trees - I find it best to start with the surname list on the match review page and find surnames they have in common with each other, then see if those surnames actually lead to a common ancestor among them. If the ancestor is found in your tree, then you know this group isn't from the branch you're looking for and you can label them and move on.

Step 3: Build a descendant tree for the ancestor you found. Make a note of any descendants who were in the right place at the right time at the right age, but we're not done yet.

Step 4: Repeat this process with the next closest match you can't identify (who isn't a part of the first group).

Step 5: Look for a descendant who appears in both the trees you've built - so someone who descends from both the ancestors you've identified. This is probably either the person you're looking for, or a close ancestor of theirs, like a parent or grandparent. If you don't find one, keep repeating this process until you do.

Chart showing the two different DNA matches groups and their shared ancestors.
Click to enlarge.

For example (shown above - these names are made up but the situation is real and came from my tree): I was looking for my grandfather's unknown biological father, so I had my grandfather take the test before he died. I first found a group of his matches (who mostly all matched each other) who were all descended from a colonial ancestor named John Smith (I told you I changed the names, lol), so I built a descendant tree for John Smith. I then found another group of matches who all descended from another colonial ancestor called Christopher Jones, and built a descendant tree for him. By building those trees, I found a descendant of John Smith - named Isaac Smith - had married a descendant of Christopher Jones - her name was Carrie Jones. This suggested that the man I was looking for was probably a descendant of Isaac Smith and Carrie Jones, and based on the dates, it could only really be one of their sons, specifically one of their four oldest sons. Eventually, a close descendant of one of the four sons tested and confirmed which of the four sons was my grandfather's biological father (below).

Chart showing the closer matches that eventually showed up and allowed me to figure out
which of the 4 brothers was my grandfather's bio father.

Granted, there could have been another descendant of John Smith who married a different descendant of Christopher Jones, and that could have led me to the wrong family - this is why too much endogamy can throw you off. But as long as there's not too much of it, you can document each case of it and using your DNA matches and how much DNA you share with them, you should be able to figure out which descendants are the ones you're looking for. But a highly endogamous population might be too complex. If I was looking for an unknown bio ancestor on my mom's Mennonite branch, I'm not sure it would be possible. I can sometimes share up to about 5 ancestor couples with matches on my Mennonite branch. And the unknown father of my Italian ancestor who was from a tiny, highly endogamous town in Italy where everyone there is related to everyone else somehow? Forget it.

However, this is the same type of method that professional Genetic Genealogists like CeCe Moore employ to identify individuals from DNA left at crime scenes (either suspects or unidentified victims). It can be done (for the most part), it just takes work, and sometimes some patience for the right matches to come in.

Thursday, August 5, 2021

Understanding Admixture and Genetic Overlap at MyHeritageDNA

MyHeritage is generally known for not having the most reliable ethnicity results. This is probably because they were latecomers to the DNA field, and they haven't yet updated their percentage reports. But of course, all ethnicity percentages are merely an interpretation of our DNA, and not necessarily very reliable anyway. And what MyHeritage does do a great job of (unlike AncestryDNA), is showing us lots of data on all the genetic overlap among neighboring regions, so we can understand how it works. Not only do they show us all available regions and the areas they cover (below), but they have a section called "Ethnicity Maps" that shows us "the most common ethnicities in each country and the top countries for each ethnicity, according to MyHeritage DNA users' data." Although this is all based on data from MyHeritage, it's still a valuable learning tool for understanding admixture in general.


The percentages in the Ethnicity Maps show us the portion of testers in each country who get results in each ethnicity, or the portion of testers with results in each ethnicity within each country.


For example, looking at the data by country, if you click on Germany, you'll see 55.7% of people living in Germany get results in the "North and West European" ethnicity (above). We don't know what average percentage they get for "North and West European" because the data doesn't include that, but it's probably pretty high. It then goes on to list another 19 ethnicities down to 1.2%, from all over Europe, Asia, Africa, and even Native America. That is not all due to genetic overlap, but simply because there may be, for example, a few Asians living in Germany who took the test. For genetic overlap, it's probably best to look at the top 5 ethnicities - which is likely why their default view is the top 5. What that shows us is that lots of people in Germany also get results in East European (48.9% of testers), Scandinavian (43.6%), Balkan (38.1%), and English (23.3%), illustrating the strong genetic overlap Germany has with those nearby areas. That means if you have known German ancestry, it would not be uncommon to get results in any of those neighboring regions, especially (though not exclusively) from MyHeritage's results.


On the flip side, when you look at the Ethnicity Maps by ethnicity, it shows us the most common countries each ethnicity is found in. This gives us a good understanding of two things: the top 5-10 countries show us the areas covered by that category (although our own Ethnicity Estimate already gives us that, this can give us an understanding of just how broad that area could really be), and the full list of countries shows us how much emigration there's been from each country around the rest of the world. For example, 36.7% of people in the USA get results in North and West European, which is not surprising, considering how many German immigrants there have been to the USA over history. This doesn't really show us genetic overlap, but it is very useful for understanding modern migration patterns.

Hopefully, as MyHeritage update their ethnicity reports, they will also update this very useful data and not retire it like AncestryDNA keep doing.

Sunday, August 1, 2021

Understanding Admixture and Genetic Overlap at AncestryDNA

I talk a lot about the genetic overlap that exists among neighboring regions and how that influences ethnicity percentages, or admixture. Unfortunately, AncestryDNA keeps taking away valuable learning tools for understanding these relationships between various populations, making it harder to illustrate them. First, they removed the Average Admixture Chart, then they removed the Genetic Details page, and now they've even removed our ability to click on "see other regions tested" and explore the maps and details of any region to understand the overlap they have with neighboring regions. The only thing left is the PCA chart in the Ethnicity White Paper, but even that has always been limited to Europe. 

The Average Admixture Chart (below) used to show us what the results of a typical native of every region would expect to get. It showed how much or how little each population was admixed. So for example, if you were of 100% British descent, you could expect to actually only get about 60-70% in Great Britain (this was before they decided to attempt to split up Britain), and around 8-10% in Europe West, Ireland, and/or Scandinavia. This illustrated the common overlapping DNA among the British, Germanic people, and Scandinavians, and also the close relationship between the British and Irish (sorry, Ireland). Europe West was even more admixed, averaging less than 50% results in Europe West, and the rest coming from pretty much everywhere else in Europe except Finland/NW Russia. Scandinavia was less admixed, averaging between 80% to 90% in Scandinavia, and only small amounts from Europe West, Great Britain, Finland/NW Europe, Ireland, and a smidge from Europe East. The chart made it clear just how admixed Europeans themselves are, or can be, and to AncestryDNA, that is apparently a bad thing that they are now trying to hide, because it means ethnicity percentages, by nature, aren't always very reliable, and can't always be broken down into more specific regions. That's something customers are frustrated by, so one by one, they keep taking away the learning tools that would help customers understand this.

The loss of the Average Admixture chart wasn't too unfortunate, because the same/similar data could essentially be found on the Genetic Details page. Previously, when you clicked on a region, and then clicked "More info", there would be a page with two tabs - one which still remains with the detailed history of the population and their migrations, and the other had genetic details that helped us understand the genetic overlap that region had with nearby regions. That second page is now gone. It showed us two very important charts that basically replaced the data in the Average Admixture chart. The first one (below) showed us the average percentage that a native of that area would likely get for that region (same as you would find on the Average Admixture chart). 

The second chart (above) showed us "Other regions commonly seen in people native to [this region]". This wasn't exactly the same data from the Average Admixture chart - it rather detailed the amount of people native to that region who got any amount of results in which neighboring regions. So it didn't tell us the amount a native would expect to get in those other areas, but how common it was for a native to get results in those other areas. Not exactly the same data, but still valuable data for understanding common overlap.

With these two vitally important learning tools gone, I often turned to the simple map and details of each region to illustrate how each region often covers neighboring regions as well. If you click on "Read full history" for each region, you can find not only the areas "primarily found" in that region, but the areas "also found in" that region too (above). Unfortunately, AncestryDNA has neglected to add the "Read full history" link to some of the newer regions (like Scotland) they added recently! An oversight? Or an indication they may also be retiring this page altogether now too? And on top of that, a new revamp of the appearance of our ethnicity results (may not be available to everyone yet) seems purely aesthetic at first, until you notice the link to "See other regions tested" is now gone too (below). 

It's as though they don't want people to understand how much genetic overlap there is between certain regions, even though it would greatly help people to understand their results. And now, anytime people ask, "If I get results in X, is it coming from my Y ancestry?" and it's not a region I have results in, I can't answer them because I can't look up the map and details of regions I didn't personally get results in. This kind of question gets asked so frequently in social media, and frankly, people like me basically wind up fielding these questions for Ancestry's customer support, and they keep making it more and more difficult. I guess if they really want a huge increase in the load on their customer support, that's fine, but if that's the case, they really shouldn't have gotten rid of their support email (you can now only contact them by phone, or social media like Facebook). So, they're making it harder for customers to understand their results, and harder for customers to contact them about it. Epic fail on customer service, AncestryDNA.

Edit: AncestryDNA did later re-add the "see other regions tested" link. Apparently it was just an oversight during their updates at the time.

The only remaining tool is the PCA chart (top), which is limited to Europe and therefore not much help in understanding results outside of Europe, or any relationships that might exist in the crossroads between Europe and other continents. And frankly, I have some concerns that voicing this will lead to them to remove the PCA chart too.

The percentage range included in our results is also useful for understanding that the percentages are very much an estimate, but not very useful for understanding the genetic overlap between regions. Still, hopefully they don't retire this feature either, but the ongoing trend doesn't bode well for it. 

Wednesday, May 26, 2021

Add Specific Relationship, AncestryDNA's Latest Feature


It sounds like it hasn't been rolled out to everyone yet, but it should be coming soon - AncestryDNA is (finally) adding the ability to change the estimated relationship range with a DNA match to a specific, known relationship instead. They're a few years behind 23andMe and FTDNA (although 23andMe still don't have shareable family trees so 23andMe is no better overall), but better late than never.

In the process of adding the specific relationship, it asks you which side of your tree the match is from, your mother's side, father's side, or both. And for matches you're unsure of the specific relationship, but you know which side of your tree they come from, there's an option to select which side and then instead of choosing a specific relationship, you can click "I'm not sure". It will then display "Mother's Side" or "Father's Side" (or both) without a exact relationship (the original estimated range will remain). 

Unfortunately, it does have some limitations. The main one is that it only goes out to 5th cousins, and any more distant relationships only have an option for lumping them all into a general "Distant Relationship" label. Not only does this rather defeat the purpose of being able to add a specific relationship if it's not actually a specific relationship, but it's also inconsistent with ThruLines, which at least goes out to 6th cousins (though that too is arguably a little limited). So essentially, ThruLines is going to show us our exact relationship with many 5th cousins once removed and 6th cousins, yet the new feature offers no way to add those specific relationships. The least they could do is expand it to the 6th cousins so it's consistent with ThruLines.

The other limitation is that it doesn't let you select more than one relationship, which is a complete oversight when it comes to lots of people who have endogamous branches of their tree, and identifiable endogamy (more than one set of most recent common ancestors) with many matches. Even when you select "Both Sides", it doesn't give you the option for more than one relationship. If it's a close match, assumes you've selected both sides because the person is someone like a niece or nephew, or full sibling, etc. Someone who shares your whole ancestry. If they aren't a close match, it seems to assume that although you may have two different relationships, they must be more distant than 5th cousins and only gives you the option to select "Distant Relationship". I suppose they're trying not to over complicate it for newcomers, but for people who use this for heavy research and breaking down brick walls in their tree, noting multiple relationships is vital.

It should also be noted that if one or more of your parents have tested, the system will automatically assign a match to your mother's side or father side depending on who they match. If for some reason, the system got it wrong, or only selected one when they actually match both, you can edit this by simply clicked the back button in the upper left corner of the side window (highlighted in yellow in the screenshot below).


That pretty much sums it up. In general, it's great they finally added this option, I know lots of people have been asking for it for a while. And I have gone through and selected known relationships for all the matches I've identified. But you may notice I have, for a very long time now, always noted the relationship and shared ancestor(s) in the notes field (along with emojis I used before groups were available). Unfortunately, due to the limitations of the new feature, I will have to continue noting the relationship myself in the notes field instead of relying solely on Ancestry's tool.

Monday, December 7, 2020

FamilyTreeDNA Updated Ethnicity Results

FTDNA have jumped on board the update wagon, and a few months ago, released myOrigins 3.0. They've broken down some regions into more specific locations, but not a huge amount and of course, they still find it impossible to accurately tell apart the British Isles, Scandinavia, and Germanic trifecta (though that's not unusual for most companies).

Here's my result history with FTDNA:

myOrigins 1.0:
Scandinavia 34%
Western/Central Europe 26%
Southern Europe 20%
Finland/Northern Siberia 3%
Asia Minor 12%
Eastern Middle East 5%

myOrigins 2.0:
British Isles 54%
Southeast Europe 33%
West and Central Europe 6%
Finland < 2%
East Middle East 3%
West Middle East < 2%

myOrigins 3.0:
England, Wales, & Scotland 48%
Scandinavia 11%
Ireland 5%
Greece & Balkans 28%
Italian Peninsula 8%

With Version 3, they've wrongly put most of my Italian ancestry into Greece, whereas most other companies are able to tell the difference better than this (I usually only get trace amounts in Greece, if anything, except at MyHeritage). Added up, it still equals about 36% Southern European though, which isn't far off the mark (should be about 32%).

And as noted, I have no results for Germanic now (previously West/Central Europe, now simply called Central Europe), when I should have around 20-25%. That means my British results (England, Wales, & Scotland) are somewhat inflated. Scandinavia is consistent with my tree though, since I had one Norwegian great grandparent. And they've finally managed to get rid of the trace amounts in unlikely locations (like Finland and Middle East). Considering it's common for companies to not be able to tell British from Germanic, the results aren't entirely off base.

My mom's kit probably saw the biggest change (she did not test early enough for Version 1):

myOrigins 2.0:
Scandinavia 42%
British Isles 35%
East Europe 18%
Southeast Europe 3%
East Middle East < 2%
West Middle East < 2%

myOrigins 3.0:
England, Wales, & Scotland 91%
Scandinavia 9%

My mom's tree is also about 20-25% Germanic so the lack of any results in that area yet again seems to suggest their results lean towards Britain instead. Likewise, her Scandinavian results went from one extreme to another and most of it went to Britain. She had one Norwegian grandparent, so should be about 25% Scandinavian. The fact that they can't get this anywhere near close suggests my Scandinavian results being fairly accurate might just be a coincidence.

Although they managed to eliminate the trace results in inconsistent locations like Southeast Europe and Middle East, and also removed the high percentage in East Europe where my mom has no ancestry, I'm not sure I'd say the update is a huge improvement for my mom.

My dad's results (again, no Version 1):

myOrigins 2.0:
West and Central Europe 65%
Southeast Europe 8%
Asia Minor 22%
East Middle East < 2%
North Africa < 1%
Scandinavia < 2%
West Middle East < 2%

myOrigins 3.0:
Italian Peninsula 38%
Malta & Sicily 15%
Scandinavia 22%
England, Wales, & Scotland 14%
Central Europe 8%
Ireland <2%
Anatolia, Armenia, & Mesopotamia <2%

They've at least managed to correctly put his Italian ancestry in Italy instead of Greece! My dad is half Italian (Southern Italian), and his results add up to 53%, so that's very close. However, I don't know where that Anatolia, Armenia, & Mesopotamia is coming from - if it's from his Italian ancestry, that adds up to 55%, which is moving away from accurate. Additionally, his British ancestry should be about 20%, so 14% is not far off from that.

Unfortunately, it's downhill from there. My dad has no Scandinavian ancestry, so 22% is really high, but he does have a lot of German ancestry (about 30%), so only 8% in Central Europe is very low. I guess I should just be pleased he got any results in Central Europe at all, given that my mom and I don't!

My paternal grandfather's results:

myOrigins 1.0:
Scandinavian 48%
Southern Europe 32%
British Isles 11%
Jewish Ashkenazi Diasporia 5%
Central Asia 4%

myOrigins 2.0:
West and Central Europe 84%
Scandinavia 8%
Asia Minor 7%
Ashkenazi < 2%

myOrigins 3.0:
England, Wales, & Scotland 62%
Central Europe 26%
Scandinavia 11%
Malta & Sicily <1%
Ashkenazi Jewish <1%

I really don't know why FTDNA insist on giving him Ashkenazi results when no other company does and has no known Jewish ancestry. His results really should be very straight forward - he's roughly 40% British and 60% German. And for the first time ever, FTDNA is giving him significant amounts in both Britain and Central Europe (usually it's one or the other), though if the numbers were swapped, it would be more consistent with his tree.

Finally, my husband's results:

myOrigins 2.0:
British Isles 97%
Ashkenazi < 2%
Northeast Asia < 1%
West Africa < 1%
Iberia < 1%
Oceania < 1%

myOrigins 3.0:
England, Wales, & Scotland 60%
Ireland 35%
Scandinavia 2%
Magyar 2%
Ghana, Togo & Benin <1%

My husband being a British native/citizen with no known ancestry outside the British Isles, if we dismiss the low results in Scandinavia, Magyar, and Ghana/Togo/Benin as noise, his results are probably the most consistent with his tree yet. He's basically half British and half Irish, so 60% British isn't too bad. Version 2 lumped them both together though, which meant 97% British Isles was probably even more accurate. This is a good example of how the broader the regions are, the more reliable they are.