Wednesday, August 22, 2018

Review of AncestryDNA's New Ethnicity Estimate Update (Beta)

My new results
As discussed previously, there is an update in the works for AncestryDNA's Ethnicity Estimate, currently still in beta mode, you may be able to manually access it as detailed here. Three out of my five kits were able to update - but are the new results actually better, or more accurate? In some ways, yes, and for certain people, yes. But in other ways, and for certain people, a definite no. It seems to work best for people who are less mixed. For example, if your ancestry is entirely English, versus someone who is English, German, Italian, etc then you very well might be finding that the new results are more consistent with your tree. It seems for those of us who come from various backgrounds, the ethnicity report can be a little bit all over the place, and not in a way that is consistent with our known ancestry.

My old results
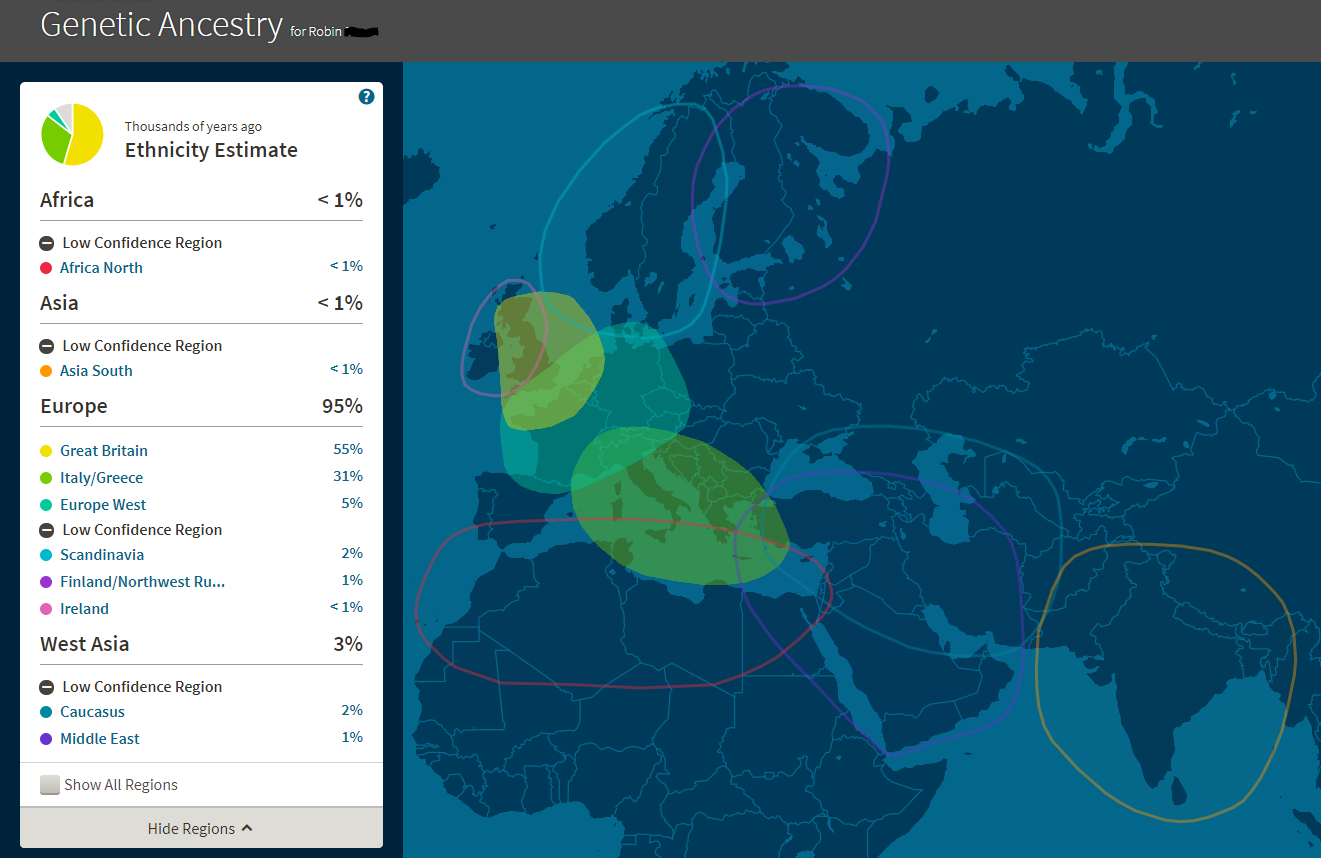
I'll start with myself. As I'm sure I've mentioned many times, I am a mix of British, German, Italian, and Norwegian (and a little bit of Dutch and French Huguenot, but that may be from too far back for the ethnicity report to be relevant). The new update (shown above) seem to be a bit thrown off from my variety of admixture.

Granted, they do seem to have dropped most of the results from outside Europe I had before (see right), which is more consistent with my tree. I am now 99% European and only 1% Turkey/Caucasus, whereas before I only had 95% in Europe.

However, I'm still getting a lot of low percentages in areas surrounding where my ancestry comes from (2% Spain, 2% Greece/Balkans, etc), they are just now mostly in Europe instead of outside it. I also notice that AncestryDNA have done away with labeling "low confidence regions", which were previously defined as "when an ethnicity has a range that includes zero (meaning that in at least one of the 40 tests, that ethnicity didn’t appear) and doesn’t exceed 15%, or when the predicted percentage is less than 4.5%". Now, results which fall into this are no lower identified as such, suggesting that AncestryDNA are much more confident about even low percentage results/ranges. Sadly, I'm not convinced they have earned that confidence.

Due to the fact that my paternal grandfather tested, I know I share 18% of my DNA with him, rather than the "expected" 25% (this is normal), which means I inherited 32% from my Italian paternal grandmother. Before the update, AncestryDNA estimated my Europe South component at almost exactly what it should be: 31%, so I should have known that any deviation from this was going to be a step in the wrong direction, but the mere 12% Italian was still somewhat of a shock. Even if I add up the small amounts in surrounding areas for a Southern European total, I'm still only up to 17%. Not only was AncestryDNA's original prediction consistent with my tree, it was also very consistent with most other companies. FTDNA gave me 33% in Southern Europe, 23andMe had me at 29.5% Southern Europe, and LivingDNA at 30.2%. The only outlier was MyHeritage at 41.6%, which is partly why I felt MyHeritage's reports were less reliable than everyone else. But now, AncestryDNA must join the ranks of MyHeritage. My Northern vs Southern European ancestry has always been easy for most companies to tell apart so this seems like a big step in the wrong direction for me.

There are, of course, other discrepancies between the new report and my tree, but they are less severe. Although AncestryDNA is attempting to narrow regions down to more specific areas, it's not always reliable. I do not have as much French ancestry as they are suggesting at 18%, but if you add it together with Germanic, another 18%, you get 36%, which isn't that far off what I estimate from my known ancestry (about 21% German/Swiss/Dutch). So in some cases, I think we still need to look at broader areas and combine neighboring regions despite AncestryDNA's attempt to break them down.

Great Britain - old ethnicity map
Of little consolation is the fact that my 7% in Norway is a little closer to what I might expect to have gotten from my one Norwegian great grandfather, and my England/Wales results are exactly what I estimated my tree to be, 32%, whereas before it was a bit overestimated at 55% Great Britain.

This brings me to the point I want to make about the new regional names of the British Isles. Despite the name change, we're not actually seeing any difference in the areas these groups primarily cover.

Previously, Great Britain (map shown above/right) was defined as:
Primarily located in: England, Scotland, Wales
Also found in: Ireland, France, Germany, Denmark, Belgium, Netherlands, Switzerland, Austria, Italy

England, Wales, and NW Europe
new ethnicity map
And now "England, Wales, and Northwestern Europe" (map shown right) is defined as:
Primarily located in: England, Scotland, Wales
Also found in: Ireland, France, Germany, Denmark, Belgium, Netherlands, Switzerland, Luxembourg

So despite the name change, they both primarily cover England, Scotland, and Wales - the only change was to a couple of the secondary regions it might cover (no more Italy and Austria, but Luxembourg was added).

The same is true for what was previously called "Ireland/Scotland/Wales" (map shown below):
Primarily located in: Ireland, Wales, Scotland
Also found in: France, England

Ireland/Scotland/Wales - old
ethnicity map
And now the new "Ireland and Scotland" (map shown below/left):
Primarily located in: Ireland, Wales, Scotland
Also found in: France, England

As you can see from the descriptions, it's exactly the same coverage.

So don't let the new names fool you, "England, Wales, and NW Europe" doesn't cover mainland Europe any more strongly than it did before, and it doesn't mean ancestry from Scotland (or even Ireland) can't still turn up under this category. I do not know why they are adding "Northwestern Europe" to the title of this group when it is not listed under the locations it's primarily found in. I expect this will undoubtedly be confusing to some people. Likewise, Wales may have been dropped from the now named "Ireland and Scotland" but you can see from the description and maps that it's still included in this group as a primary location. This is why it's so important to look at the details and not just go off the category title.

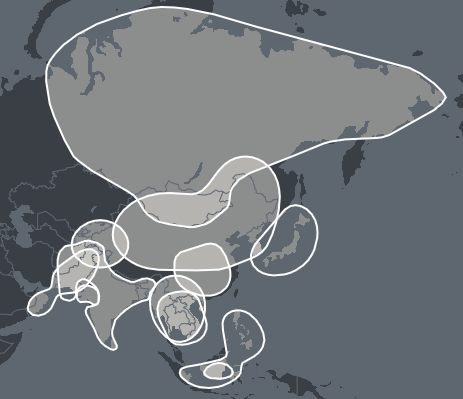
As you can see from the coverage maps I've also included, those haven't changed much either. They appear to have only changed the maps to better reflect the descriptions, not because the descriptions have changed. For example, previously Great Britain didn't list Norway in it's description of "also found in", yet the map did cover the southern tip of it, whereas now it does not. Previously, the map for Ireland, Scotland and Wales did not cover France even though it was included in the description, but now it does. So although the maps have changed slightly, it's not because the category is primarily covering any different areas.

It should be noted that although the regions these groups cover haven't changed, that doesn't mean your results in those categories won't. AncestryDNA have significantly updated their reference panel from 3,000 to 16,000, so we are seeing changes to the genetic make up of these groups in the reference panel, which will very likely reflect changes to the percentage you get in those categories.

Obviously, mainland Europe is seeing significant changes to the breakdown and coverage of different regions. Europe West, previously "primarily located in": Belgium, France, Germany, Netherlands, Switzerland, Luxembourg, Liechtenstein and "also found in": England, Denmark, Italy, Slovenia, Czech Republic is now broken down into "France" and "Germanic Europe", which respectively cover:

Primarily located in: France
Also found in: Andorra, Belgium, Italy, Luxembourg, Monaco, Spain, Switzerland

Primarily located in: Germany
Also found in: Netherlands, Belgium, Switzerland, Austria, Czech Republic, Denmark

Unfortunately I don't have the room or time to detail every new region, especially with maps, but you can see from the completely list how different the breakdown for Europe is now:

Europe
  • Baltic States
  • Basque
  • Eastern Europe and Russia
  • England, Wales & Northwestern Europe
  • European Jewish
  • Finland
  • France
  • Germanic Europe
  • Greece and the Balkans
  • Ireland and Scotland
  • Italy
  • Norway
  • Portugal
  • Sardinia
  • Spain
  • Sweden

And for the rest of the world:

Africa
  • Africa South-Central Hunter-Gatherers
  • Benin/Togo
  • Cameroon, Congo, and Southern Bantu Peoples
  • Eastern Africa
  • Ivory Coast/Ghana
  • Mali
  • Nigeria
  • Northern Africa
  • Senegal
America
  • Native American—Andean
  • Native American—North, Central, South
Asia
  • Balochistan
  • Burusho
  • Central and Northern Asia
  • China
  • Japan
  • Korea and Northern China
  • Philippines
  • Southeast Asia—Dai (Tai)
  • Southeast Asia—Vietnam
  • Southern Asia
  • Western and Central India
Pacific Islander
  • Melanesia
  • Polynesia
West Asia
  • Iran/Persia
  • Middle East
  • Turkey and the Caucasus

Unfortunately, Africa and Pacific Islander don't see any further breakdown but that doesn't mean you won't see changes to your percentages or regions. America only see the addition or distinction of Andean, and West Asia sees a two part area now split into three. The biggest changes aside from Europe have happened in Asia, and it's about time. Ancestry's previous Asian groups only covered three very large regions: Asia Central, Asia East, and Asia South. Now there's 11 regions! I frequently used to recommend East Asians wanting to take a DNA ethnicity test to go with 23andMe, not AncestryDNA, but now I don't have to.

It should be noted that the update does not influence your Genetic Communities or Migrations. You might find some of them are now organized under a new parent region due to the new breakdown of the regions, but that's the most of it. The Genetic Communities/Migrations are determined through different methods using a different reference dataset (which is precisely why I still believe they shouldn't have been merged as sub-regions as though they are the same) so they aren't going to change with this update.

I think that covers enough for now. I will detail the changes to my other kits in another article.

Tuesday, August 21, 2018

How to get the AncestryDNA Ethnicity Report Update (Beta)

AncestryDNA's new breakdown of Europe - now 16 regions
Many of you may have noticed a lot of talk about the update in the works for AncestryDNA's ethnicity estimate. Some of you may have already received it. It is currently still in beta testing, which means only certain tests are included and Ancestry are still tweaking it based on the feedback they're getting. We are at Ancestry's mercy for who gets updated and when.

Or are we? Here's a secret, shhh: many of you may be able to "force" the update. It apparently doesn't work on all tests (at first I thought it only worked on tests from the V1 chip, since both my kits on V2 didn't work, but then I got feedback it was the opposite for some people), but it doesn't hurt to try.

Open your ethnicity estimate or "DNA Story" page. In the URL bar, remove everything in the URL after the "code", the long string of numbers and capital letters. Once you've removed all that, it should look like this (with a different code, of course - this is mine and shouldn't work for you since you're not logged into my account - at least, you shouldn't be!):

https://www.ancestry.com/dna/origins/A9BA4988-54FA-4823-A9CB-7CF2C9355AD1

Now, at the end of the URL, add "/transition" (without the quotation marks, of course). So now it looks like this:

https://www.ancestry.com/dna/origins/A9BA4988-54FA-4823-A9CB-7CF2C9355AD1/transition

What happens when it doesn't work - blank results
This will generate a survey on your expectations of your ethnicity report. When the survey is complete, you'll be able to see a preview of your new, updated ethnicity report and a comparison with what it previously was. You won't be able to click any of the categories or regions to see the details, but scroll down and below all that you will find a button that says "Keep Update". If you're happy with the update, you can click this button and your report will be officially and permanently updated, and then you can click on the groups to see more details (and your previous results will still be visible if you click "Up to date" but not in as much detail).

Like I say, it does not work for everyone. 2 out of my 5 kits showed completely blank results at the end of the survey (nothing on the map, and only previous results listed on the side - show above) and clicking on "Keep Update" did nothing (the spinning circle just kept spinning).

In a couple days, I will be detailing my own results and exploring whether the update was worth it or not.

UPDATE 08/22/2018: AncestryDNA have now added a message saying "Still processing results" for kits that the transition option doesn't work on. It's unclear whether they are actually processing them or whether they've just tossed this message up to appease people, or when the update will ever be available for them.

UPDATE 08/24/2018: It's become clear that AncestryDNA have shut this loophole down completely and anyone who wasn't able to access it and click "keep update" beforehand is now getting this "still processing" message. According to a statement they made on Facebook: "That process was not an official way to get the updated regions." Makes you wonder how it was even accessible to begin with if that's the case. Anyway, in the same statement, they say "If you haven't received the DNA ethnicity update yet, you should receive it very soon!" Considering it took them about 3 years to bring the Family Group Sheets back like they promised, I'm betting "very soon" means something different to them than it will to most users.

Monday, July 23, 2018

Ancestry's "We're Related" App

We're Related app
My relationship to Stephen Amell
is confirmed
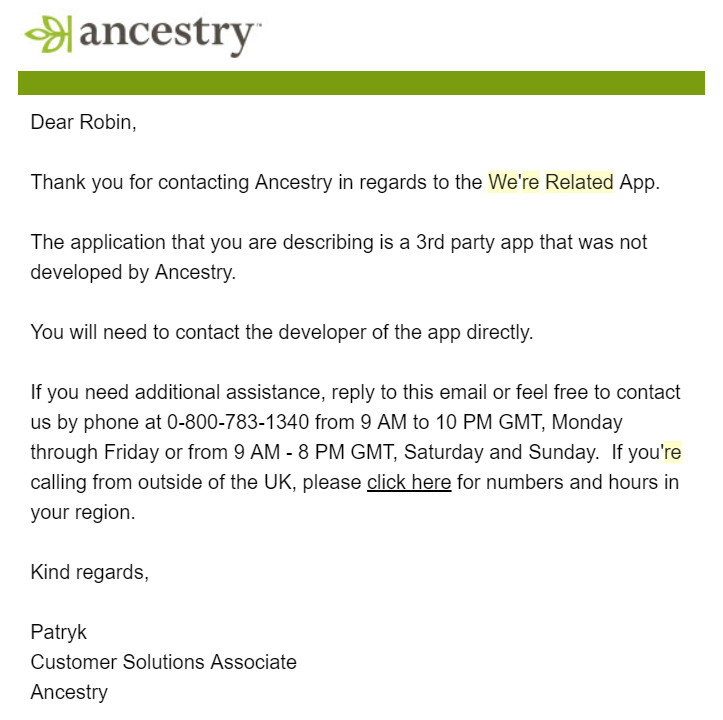
Edit to add Mar 28, 2019: Since publishing this article, it's come to my attention that the We're Related app is no longer available from app stores to download. It will still function if you still have it on your device, but you can no longer download it. I contacted Ancestry.com support about this, but they refused to give me any information on when and why the discontinuation happened and why there was no announcement, and instead flat out denied that they even owned the app (see below). Maybe they sold it at some point, but they most definitely owned it at one point, as proven by older community/Facebook topics answered by Ancestry reps as though they manage or own it found here in 2017 and here in 2016. So I've now asked them if they sold it, when and why did that happen and why was there no announcement. No response yet.

I know it's only a little app that produces a lot of false connections, but this lack of communication and transparency with their paying customers is just so typical of Ancestry.com.

Edit to add July 29, 2019: Ancestry.com have finally recently sent out an email about the discontinuation of the We're Related app, and added a help article detailing the same, available here. How odd that they would finally announce the discontinuation of an app they claimed they didn't even own back in March. While it's nice to finally see some acknowledgment of this, it just highlights the fact that their customer service reps either don't know what they're talking about or are just flat out lying.

Ancestry's denial that they ever owned the app which they've
now finally announced has been discontinued.


--------------- Original article:-----------------

As many of you may know already, Ancestry.com has an app available called "We're Related". It's a fun little app that looks at Ancestry's vast database of user created family trees and attempts to find common ancestors between you and famous people, both of today and in history. It probably goes without saying that you should be careful about accepting the authenticity of the connections the app makes, given that it's based on user created trees and we all know how error-filled they can be, but that doesn't mean it can't be accurate sometimes.

Out of curiosity, I set out to determine how many of the famous people it's claiming I'm related to are actually accurate. Admittedly, I haven't gotten very far because most of the common ancestors the app finds are colonial, meaning they can be difficult to research. That doesn't mean the app is wrong, just that a lot of them can't be confirmed or denied either way. But so far, I have been able to confirm one link, and deny another.

I started with the ones who had common ancestors I recognized because they were already in my own tree (the app will extend on your tree to find common ancestors even further back than you've researched). That way, I at least knew my own descent from that common ancestor was accurate, and only had to research the path from the common ancestor to the famous person in question.

So the first famous person I've been able to confirm my relation to is Stephen Amell (shown above). For those of you who don't watch the TV show "Arrow" based on the D.C. Comic's superhero Green Arrow, Stephen Amell is the star of the show (also, you're missing out). He's not exactly an A-lister but it's still pretty cool. Additionally, although the app doesn't mention it, Stephen Amell's cousin is Robbie Amell, who had a brief part in the corresponding TV show, The Flash, and it's their shared ancestry which I also share so I'm related to both of them. Our shared ancestors are Jacob C Gottschalk, who was the first Mennonite bishop in America (not to be confused with the first Mennonite minister in America, the more famous William Rittenhouse), and his wife Aeltien Symons Hermans. My path to Jacob is well documented, since he was a somewhat well known historical figure, at least among Mennonite history, his descendants are well documented, which made researching down to Stephen and Robbie Amell fairly easy as well. Jacob was my 7th great grandfather and Stephen's 9th great grandfather, making us 8th cousins twice removed.

App shows the path from alleged
common ancestor to the Cole
family
Sadly, not all the connection are this easy to confirm, nor are they always so accurate. I went after another suggested relation, Nat King Cole (shown right). The app seemed to think we shared ancestors Peter Schumacher and his wife Sarah Hendricks. Again, these ancestors were already in my tree so I knew they were accurate and only needed to research down Nat King Cole's side. On his path, the app suggested that Peter and Sarah's daughter was Fronica or Frances Schumacher, which indeed she was and I already had her in my tree. The next step showed Fronica's son Peter Van Bebber b. 1695, which was again correct according to the research already in my tree. But next it claimed that Peter's daughter was an Esther Van Bebber b. 1707 who I had no record of and anyone with any kind of observation skills will immediately notice that it's highly unlikely Peter had a child when he was only 12 years old. So I don't know who has this lineage in their tree that the app is picking up, but it's probably incorrect and it's a good thing I checked it before accepting it as fact. Looks like I'm probably not related to Nat King Cole after all. Bummer.

The good thing about the app is that it does use words like "Possible Common Ancestor" so hopefully people don't take it too seriously without researching and confirming connections. Additionally, at the bottom of each pathway (either from you to the ancestor, or the famous person to the ancestor), it asks "Does this path look correct to you?" and offers a thumbs up or thumbs down (shown below). Unfortunately, it doesn't offer any kind of comment box for you to detail what looks wrong about it if you thumbs-down it, but it's better than nothing.


Also noteworthy is the one I found in which the pathway from me to a common ancestor who is in my tree may have been wrong. When looking at the suggestion for my relation to Elizabeth Montgomery, we allegedly share known ancestors of mine, Robert Cobbs and Rebecca Vinckler - however, when I open up the pathway from myself to Robert, there is a very noticeable inconsistency with my own tree on Ancestry.com. In my tree (which the app is supposed to be working off of), Thomas Cobbs Jr is obviously the son of Thomas Cobbs Sr, who is the son of the Robert Cobbs in question, but in the app, it bizarrely has the mother of Thomas Cobbs Jr as Susanna Moon, who is then the daughter of Mildred Cobbs, the daughter of Robert.

Now, I supposed it's not impossible that the pathway in the app is correct and I just have yet to discover it, which would mean I am descended from Robert Cobbs in two ways. But that would also mean Susanna Moon married her uncle, and that sounds kind of gross and highly unlikely. I know it's not uncommon for 1st cousins to marry, but uncle and niece? It's not something I've ever come across (except in royalty/nobility, but that's different). Given the unlikeliness of this situation to begin with, and the fact that I have no record of Robert having a daughter named Mildred, I think this pathway is probably inaccurate. Even assuming for a moment it's correct, it's still strange that the app went with a pathway which is not in my tree instead of the one which is. So make sure you look at each pathway, even if the common ancestor is already one in your tree who you've confirmed. Don't just assume since the ancestor is correct, the pathway to you is as well. Regardless though, I am descended from Robert Cobbs, and so if Elizabeth Montgomery is as well, then we are indeed related, even though the pathway is wrong.

Although I have some criticisms of the app, it does give me a lot to do when I'm stuck on brick walls in my normal research. This gives me something different to explore, while still working on my family tree. Hopefully, as I carry on with it, I can continue to confirm or deny more and more relationships to famous people.

(Note: when you first set up the app, it will take a few days to look for and start generating people you're related to, and it will continue to update and add more and more people to the list over time.)

Wednesday, May 16, 2018

Making the Most of Your DNA Matches

One of the more frustrating aspects of AncestryDNA is how few people have a family tree available, and when they do, it's often private or a tree so small you might think you can't get any use out of it. Of course, I would encourage everyone to contact their DNA matches with private trees and politely ask for an invite, and I would also encourage people to contact their matches who have no trees, as they might know enough about their ancestry to make a connection between you even if they didn't add it to a tree. But often times, people don't respond to our messages, or they decline our invite request. Dead end after dead end, right? Well, there are a few ways around these dilemmas. Although some a little specific to AncestryDNA, they can often be utilized with other companies too.

1. Look for a family tree, even if one isn't attached.
When you open the match details page, if there is a family tree available but not attached to the DNA test, it will have a drop down menu where you can select the tree to preview (shown above and left). In the screenshot above, it shows how initially, it looks like this DNA match has no family tree, but they do have one unattached to their DNA results. Selecting it from the drop down menu brings up a preview. It's a small tree, but enough to identify our most recent common ancestor, since their grandfather was the brother of my great grandmother.

This one you do need to be careful with because while sometimes, people simply forget to attach their tree to their DNA test, it's also possible that the family tree doesn't belong to the person whose test you match (or the tree may belong to that person but they are not the "home person" for the tree, as is automatically selected). For example, one of my close cousins has taken the test, but his wife is managing it. His wife has started her family tree, but not his, and I only know this because I know them well enough to know whose tree it is. To anyone else who doesn't know them, they could mistake the wife's tree for his own. In this case, there is a good reason the tree wasn't attached to the test. So definitely look for those unattached family trees, but don't make too many assumptions about them.

Don't dismiss a tree like this!
2. Build a tree from their shrubs.
Don't dismiss trees that seem too small to make any use of. As long as they have deceased ancestors in their tree (whose details are therefore public) you can do what genealogists do best: research! Build on that tiny shrub of a tree, researching further back than the tree owner did until you find your common ancestor.

In the example above/left, you might look at this family tree and think there is not enough information to find the most recent common ancestor, but you'd be wrong. This person's father is a descendant of my 4th great grandparents John Hendricks Godshalk and Barbara Kratz. How do I know? Because I took this tiny tree and I researched the ancestors until I connected it to my own tree.

3. Build downwards on your own tree.
Research all the descendants of your known ancestors, as far down as you can. It really helps when you're trying to make a connection with a small 'shrub' of a tree such as discussed above. You won't have to research your match's tree back very far if you've already done the work on your own tree.

This is especially useful for trees with endogamy - for example, I have a branch of Mennonites on my tree and after tracing many other descendant lines of my ancestors, it quickly became clear there are a number of surnames that are strongly associated with the colonial Mennonites who settled in Pennsylvania, especially when more than one appears in a tree. So if I see names in someone's tree like Oberholtzer, Funk, Detweiler, Bergey, etc, even though none of these are my ancestors, I immediately know they are likely from my Mennonite branch just from seeing the surnames. In fact, in the screenshot above the match's father's name was Detwiler, immediately suggesting I should follow that side back until it linked to my own tree, and it did. Even on branches without endogamy, it can still be useful, just not as immediately apparent.

Notes always showing in list allows me to quickly see
which ancestors I share with matches I have in common
with someone
4. Look at your Shared Matches.
If there really is no tree whatsoever you can make use of, and the person won't respond to your messages, all you can do is look at the DNA matches you have in common with each other. If any of them are matches you've already determined your shared ancestry with, then it's possible this match is also descended from the same branch. If more than one are descended from the same branch, then it's very likely this person is too. The more shared matches who descend from the same branch or ancestor, the more likely the person with no tree does too.

This process can be sped up greatly by using a Chrome extension called MedBetterDNA. It has the option to "always show notes", which means any notes you make on a DNA match will show up in the list of matches, including the list of Shared Matches. In other words, every time you identify the shared ancestor of a DNA match, make a note of that ancestor in the notes section, then every time that match is a Shared Match with someone else who doesn't have a tree, you will know it without having to open up additional match's details. See the screenshot example above. I can't not stress enough how much more efficient this has made my workflow.

5. Use the Search option for private trees.
It's frustrating to see all those private trees, especially when the owner doesn't respond. But you can get an idea of what surnames are in their tree by using the search option. That doesn't mean your shared ancestor is definitely from that surname, but it is especially useful for private trees you have a Shared Ancestor Hint with. Knowing you do have a shared ancestor with that match makes it much more likely a shared surname is the source of that ancestor. This method is a little tedious though, since you have to randomly search for surnames from your tree and hope you get a hit for the match you're looking for, but you should theoretically get there eventually if there is a Shared Ancestor Hint. However, be aware that the search function isn't hugely reliable and often misses people who definitely have a surname you're searching for in their tree. I think it's a site indexing issue. So it doesn't always work, but when it does, it's helpful. It is also useful in combination with the above tip (a surname search result plus Shared Matches who are confirmed from the same branch as that surname is very good evidence your Shared Ancestor Hint is from that branch).

6. Test other family members.
Testing family members, especially parents, is beneficial because you can at least see which of your matches also match those family members, and therefore which side or branch of your tree the shared ancestor is likely from. No tree? Won't respond to messages? No shared cousins who have been identified yet? Well, at least I can see whether they match my mom, dad, paternal grandfather, or any of my known, close cousins on either side who have tested.

Be aware that the Shared Matches feature only includes high confidence (or higher) matches who are estimated 4th cousins or closer, but if you manage any of your family member's kits, you can see which matches you have in common at any level/degree by opening that match's profile. In the example above, you'll see my dad (Jim) matches Agnes and two other kits she manages, even though they do not meet the criteria of "Shared Matches". So when I look at Agnes or her other kits in my match list, it won't show my dad as a shared match to them, even though you can see here by opening Agnes' profile, they are a match to my dad. So not only testing other family members, but getting permission to manage their test is also very beneficial to at least figuring out which side/branch someone is connected to.

7. Search the internet for your DNA match
This one may seem a little intrusive to some, but the data is public and it's out there, so why not make use of it? There are certain websites like familytreenow.com, truepeoplesearch.com, and pipl.com where you can search for people by their real names, or sometimes by a username. Ancestry.com and FamilySearch.org has some public records of living people too. Even just a Google search can yield results; some people use their real names on AncestryDNA - so search for it. Sometimes, you can find them on Facebook or other contact details. Sometimes, you can find out their parents names, and from there, build a tree and connect it to your own. I know these sites can be controversial to some who feel they are a violation of privacy, but they are using public data and not violating any laws. If you are concerned, you can request your information be removed from these sites.

Even when people use anonymous usernames, sometimes they post on Ancestry's message boards with info on their tree and you can find them by Googling the username. Sometimes they use the same username on other websites and you can get in touch with them that way.

It is important to remember that not everyone has as great an interest in genealogy and DNA as we do. Many (perhaps even most) people take the test only for the ethnicity report and may never return to the site after seeing them. Others might be adopted and not know anything about their biological ancestry, and in some cases, there are individuals who might have died after taking the test and not given any family members access to their account. There are many reasonable explanations for why people don't respond to our messages, so try not to get too frustrated by it. Focus and work with what you have, and don't let the rest get to you or you'll drive yourself crazy!

Tuesday, April 17, 2018

Which DNA Company is the "Best" for Ethnicity?

It frequently gets asked which DNA company is the "best", especially based on the ethnicity report alone. It's important to know that the ethnicity report is only ever an estimate, and they can vary greatly among the different companies, but which one is more accurate can also depend on the individual. ISOGG rate 23andMe the highest for ethnicity accuracy, and Nat Geo the lowest, but they don't include LivingDNA in that comparison, and I know from social media, not everyone feels the same way about each company. So I was curious to see what the majority would say if given a survey (if there even is a majority).

Well, here it is. If you've tested with even one of the companies included in the survey (23andMe, AncestryDNA, FamilyTreeDNA, LivingDNA, MyHeritage, and Nat Geo's Geno 2.0) please consider contributing your findings, it will only take a few moments (there are a max of only 13 quick questions, fewer if you haven't tested with every company - it merely asks "have you tested with this company?" and if you answer yes, it asks how accurate you felt the results were): "Best" DNA Company for Ethnicity Survey

Results will be posted once there's enough data collected.

Tuesday, April 3, 2018

23andMe's New Sub-Regions

My new sub-regions from 23andMe
Recently, 23andMe rolled out 120+ new regions in their ethnicity report (Ancestry Composition), but they are actually sub-regions that don't include a percentage (they also aren't included in Chromosome Painting). They are calculated much the same way Genetic Communities at AncestryDNA are, which begs for a comparison.

My initial feelings on 23andMe's new sub-regions are that although they have fewer of them than AncestryDNA's 300+ Genetic Communities, it does seem as though one is more likely to get sub-regions at 23andMe than they would be to get GC's from AncestryDNA. 23andMe correctly identified that my "British & Irish" results are actually from the UK, and my Scandinavian results are from Norway. I also have a sub-region of "Italy" under my existing "Italian" results (see left) - that probably sounds rather obvious, but when you look at the list of all sub-regions, you see that there's also an available sub-region of Malta listed under "Italian" - so once again, they've correctly identified my Italian ancestry and not mistaken it for Maltese.

No European GC's at AncestryDNA
Meanwhile, over at AncestryDNA, I have zero Genetic Communities in Europe (I have one for Pennsylvania Settlers though) - see the screenshot to the right. My dad does get one for Southern Italy because he's half Italian, but no such luck for me. AncestryDNA offer 13 GC's in Great Britain, 17 in Scandinavia, and 14 in Europe South, but I get nada for any of them. 23andMe offer measly 2 sub-regions under British & Irish (UK and Ireland), and only 4 in Scandinavia, but since I actually got sub-region results, I can't complain. AncestryDNA may have more sub-regions, but if there's fewer people getting results in them, then they aren't as useful. 23andMe have certainly just raised the bar a little bit.

It is a little bit of a shame 23andMe weren't able to identify my German ancestry, separate from France and other sub-regions in this group. So far, LivingDNA were the only ones to accurately accomplish this, and it was with percentages.

If you click on "See all tested populations" at the bottom of your 23andMe Ancestry Composition, you'll be able to see that each sub-region, although having no percentage, does show how strongly you match that group with a 5 dot system (shown below). The more dots, the more strongly you match that population. Only if you have 2 or more dots does the group show up on your Ancestry Composition page, but when you click on "See all" you may find you match additional groups with only 1 dot. For example, I have 1 dot for Sweden, but I have no Swedish ancestry and because it's only 1 dot, it doesn't show on my Ancestry Composition unless I click "See all". My existing sub-regions for Italy, United Kingdom, and Norway each have 2 dots, which is why they all show up on my Ancestry Composition page.

Dots showing the strength of my
connection to these groups
You may note that none of your 23andMe percentages have changed, that's because the new regions don't include a percentage. They are calculated differently from the ethnic percentages and use a different reference database. Also, don't assume that having results in a sub-region means they are saying the entire percentage from the parent region is coming from that sub-region. In my case, it's true because I know my family history, but for example, if I also had Irish heritage, the results aren't saying all 17.2% British & Irish is coming from the UK, it could also be coming from Ireland, I just didn't get results for that. I don't actually have Irish ancestry that's not Scots-Irish though.

My previous 23andMe results
for comparison
You may have also noticed that the names of a few populations have changed. This is simply to better reflect the areas they cover, it does not mean the data has changed. Instead of "Middle Eastern" it is now "Western Asian" and "North African" is now "North African & Arabian". What was "Central & South African" is now being called "African Hunter Gatherer" (I'm not entirely sure that's a better description for the newcomers to DNA). Also, "Oceanian" is now called "Melanesian". Originally "Mongolian" is now "Manchurian & Mongolian", and "Yakut" is now "Siberian". Additionally, they appear to have removed the parent categories that once showed the accumulative percentages of some sub-continental regions. For example, it used to group my Northwest European results together - so added up (British & Irish, French & German, Scandinavian, and Broadly NW European) it was 63.3% (show left). That's hasn't changed, if you add up those groups, it's still the same percentage, they are simply no longer showing it so I have to add them up myself. Not a huge loss, but a bit of a shame that I can no longer easily see the divide between my North and South European DNA (which has always been very distinctive).

Here's a complete list of the new sub-regions:

Original 23andMe's populations for comparison
  • European
    • Italian
      • Italy, Malta
    • French & German
      • Austria, Belgium, France, Germany, Luxembourg, Netherlands, Switzerland
    • British & Irish
      • United Kingdom, Ireland
    • Scandinavian
      • Norway, Sweden, Denmark, Iceland
    • Iberian
      • Portugal, Spain
    • Sardinian
    • Balkan
      • Albania, Bosnia and Herzegovina, Bulgaria, Croatia, Greece, Macedonia, Moldova, Montenegro, Romania, Serbia
    • Finnish
    • Eastern European
      • Belarus, Czech Republic, Estonia, Hungary, Latvia, Lithuania, Poland, Russia, Slovakia, Slovenia, Ukraine
    • Ashkenazi Jewish
    • Broadly Northwestern European
    • Broadly Southern European
    • Broadly European
  • Western Asian & North African (formerly Middle Eastern & North African)
    • North African & Arabian (formerly North African)
      • Algeria, Bahrain, Egypt, Jordan, Kuwait, Libya, Morocco, Saudi Arabia, Tunisia, United Arab Emirates, Yemen
    • Western Asian (formerly Middle Eastern)
      • Armenia, Azerbaijan, Cyprus, Georgia, Iran, Iraq, Lebanon, Syria, Turkey, Uzbekistan
    • Broadly Western Asian & North African
  • Sub-Saharan African
    • West African
      • Cabo Verde, Cameroon, Ghana, Liberia, Nigeria
    • East African
      • Eritrea, Ethiopia, Kenya, Somalia, Sudan
    • African Hunter-Gatherer (formerly Central & South African)
    • Broadly Sub-Saharan African
  • South Asian
    • Broadly South Asian
      • Afghanistan, Bangladesh, India, Mauritius, Nepal, Pakistan, Sri Lanka
  • East Asian & Native American
    • Japanese
    • Korean
      • North Korea, South Korea
    • Siberian (formerly Yakut)
    • Manchurian & Mongolian (formerly Mongolian)
      • Kazakhstan, Kyrgyzstan, Mongolia
    • Chinese
      • Hong Kong, Mainland China, Taiwan
    • Southeast Asian
      • Cambodia, Guam, Indonesia, Laos, Malaysia, Myanmar, Philippines, Singapore, Thailand, Vietnam
    • Native American
      • Argentina, Aruba, Belize, Bolivia, Brazil, Chile, Colombia, Costa Rica, Cuba, Dominican Republic, Ecuador, El Salvador, Guatemala, Honduras, Mexico, Nicaragua, Panama, Paraguay, Peru, Puerto Rico, Uruguay, Venezuela
    • Broadly East Asian
    • Broadly East Asian & Native American
  • Melanesian (formerly Oceanian)
    • Broadly Melanesian
      • American Samoa, Fiji, Samoa, Tonga

You can also view a list of populations available from each DNA company here and see how 23andMe compares with other companies.

Wednesday, March 7, 2018

A Gedmatch Admixture Guide: Part 5: Spreadsheets

Also see Parts 1 and 2 on Admixture and Oracle, and Parts 3 and 4 on Admixture Proportions by Chromosome and Chromosome Painting.

Previously, I posted a link to Roots & Recombination's article on Gedmatch's Spreadsheets so I didn't go into it myself when I was detailing how Gedmatch's admixture tools work. However, I've been seeing some people still have questions so I'm going to cover it after all. Not that Dixon's explanation isn't good, but I know for me, it didn't fully click until I realized what I'm about to show you.

To find the Spreadsheet option, run your kit number through your desired admixture calculator (see Part 1 if you need help with this), and under the buttons for Oracle and Oracle, there will be a button for Spreadsheet.

Eurogenes K13 Spreadsheet

Firstly, to clarify this up front, the Spreadsheets are not your personal results. If you look at the Spreadsheet for the same calculator with different Gedmatch kits, they will all be exactly the same. Above is a portion from Eurogenes K13 Spreadsheet - compare it with your own, you'll see it's the same.

So what are they? Basically, the Spreadsheets are showing you what the more specific Oracle populations would look like when run through any particular admixture calculator. So using Eurogenes K13 as an example, the first row for Abhkasian (a small area in the Caucasus mountains) is showing you that when run through Eurogenes K13, the Abhkasian population got 1.64% in North Atlantic, 4.62% Baltic, 9.81% West Mediterranean, 54.30% West Asian, 22.78% East Mediterranean, etc. What this means is that if you were of full Abhkasian descent, you might expect to get admixture results like this.

To illustrate this, note (below) how if you add up the numbers in a single row, they add up to 100% (give or take 0.01-0.03%, as is usual even for your own results, which is probably just due to rounding up or down the individual percentages). So it's showing the admixture results of specific populations as though they were Gedmatch kits.

Spreadsheet for Eurogenes K13 showing sums of all populations

It also shows either how mixed or how exclusive a certain population's DNA is. You might expect an Italian to get results primarily in East and West Mediterranean, and indeed, most of the Italian populations (East Italian, West Sicilian, Italian Abruzzo, Tuscan, Sardinian, South Italian, North Italian, even Italian Jewish) do get high results in those categories (see below). But notice how they also get high results in North Atlantic, meaning that even people from the Southern most areas of Europe still share a lot of DNA with the Northern part of Europe (at least in this calculator). Even East Sicilians are getting 16.46% in North Atlantic.

Italian populations in Eurogenes K13 Spreadsheet

Not only can this explain some unexpected admixture results, but it can also explain unexpected Oracle results. Previously I've talked about how Eurogenes K13 Oracle 4 results matches me to a lot of Jewish populations, namely Kurdish Jewish and some Iranian Jewish. I have no known Jewish ancestry and don't get any Jewish results from any of the big DNA companies. But if I look (below) at Kurdish Jewish and Iranian Jewish in the K13 Spreadsheet, I see they have the highest results in East Mediterranean, which is expected, but also 8-10% in Wed Mediterranean, which is the same category my Italian ancestry peaks in, so perhaps there is some shared DNA there and K13's Oracle is picking up on that in my case.

Population admixtures for unexpected Oracle results 

It's difficult to find a population that gets more than 90% in one category (shown below), but one of the ones that does is Karitiana, a group of Native Americans in Brazil. This population gets 99.62% in (unsurprisingly) Amerindian, and only trace, less than 1% in other categories. The Dai population (a Chinese group) is another, getting 90.46%, again unsurprisingly, in East Asian. And another example is the Papuans (indigenous peoples Papua New Guinea) getting 94.59% in Oceanian. None of this is surprising, as these are all populations which would be expected to be fairly endogamous to begin with, knowing their histories.

The only populations to get 90+% in one category

So while this tool gives us some very interesting information into the make up of each population, and may help provide some insight into how and why your results turned up the way they did, they are not your personal results.

UPDATE: To help better visualize the Gedmatch Population Spreadsheets, I've started creating some bar charts. I'm a visual person, so I find these charts quicker and easier to make sense of than looking at a bunch of numbers. They are interactive so you can hover over sections to get details. If people find this useful, I'll keep adding them.

Eurogenes K13 Population Spreadsheet Chart
Eurogenes K13 Reverse Chart
Eurogenes EUtest V2 K15 Population Spreadsheet Chart
Eurogenes EUtest V2 K15 Reverse Chart

Saturday, February 24, 2018

Dating Old Photographs: Example #1

I have so many old photographs in my family's collection, many of whom are unknown, or at least the dates are unknown. Previously, I gave some tips on how I've narrowed down when a photo was likely taken, but I'd like share the multitude of photos I have as examples. I'll start with this portrait of an unknown woman from my family's collection. I believe her to possibly be a family friend of my ancestors, most probably the Fallows or Godshalls, given the location and time period.

My estimate: 1896-1899

With this one, the first thing I did was look up the photographer at these addresses. Louis Baul had a studio at 56 North 8th Street and also 1937 Germantown Ave, Philadelphia, during the years 1889 to 1908. This narrows it down a little bit, but that's still a 20 year period. To narrow it down further, we need to look at the materials used, as well as the clothing and hair.

The mount used is very ornate, and textured. According to Phototree.com, these became popular in the late 1890s, which fits within the photographer's time frame. Additionally, according to the fashion dating guide at the University of Vermont, the puffy shoulders you see here, particularly the size and shape, are indicative of the mid to late 1890s. The hair is also typical of the mid to late 1890s, as women began to grow out and flatten the frizzy bangs which were popular in the 1880s and early 1890s, and parting their softer waves in the center.

Lastly, the color of the photo is important too. In earlier decades, carte de visites and cabinet cards were printed on sepia like paper and card, with brownish tones to them. It wasn't until the 1890s when true black and white photos became available. This one may be a touch brownish, when I grayscale it completely in Photoshop, there's a notable difference, however, that could be attributed to age. In comparison with older cabinet cards, this is not sepia.

So everything is consistent with being from the 1890s, most probably from the late 1890s.

Monday, February 19, 2018

LivingDNA Review

LivingDNA are a British DNA company providing an ethnicity report (autosomal DNA) and a Y-DNA haplogroup (if you're male), and mtDNA haplogroup, for $159 (sales as low as $89 are periodic though). It does not include matching with other testers, although the company says this will be coming in the future, for autosomal DNA (I suspect they're trying to build up their database of testers first). They do offer a way to upload your raw data from other companies for free, however, it's well hidden and hard to find on their site (you can access it here), you won't get your results until August 2018, and it's unclear what the results will include.

UPDATE: They now make the upload easy to find with a new link (the previous URL to apply for their "research" is still available though) and have published some details of the results you'll get. The free upload will include DNA matching with other LivingDNA participants (called Family Networks), and the option to upgrade (for an undisclosed fee) for an ethnicity report. The option to upload will end October 31, 2018, so you need to hurry if you want to be a part of this. It sounds as though they are allowing uploads for the time being primarily to bulk up their database for the roll out of Family Networks.

As a British company, they have focused greatly on British DNA and offer the most breakdown available for this region than any other company at the moment. They also offer the most breakdown for Europe, the Middle East, Native America, and parts of Asia, but they are oddly lacking in any Jewish populations, and their breakdown for Africa and Oceania is fairly average. You can compare their breakdown of populations to other companies here.

But just how accurate are these more specific breakdowns? It's important to remember all DNA ethnicity reports are only an estimate, and in my experience, the more specific the regions are, the more speculative it is. It's difficult to say just how accurate the specifics at LivingDNA are. Of the known locations my British branches have come from, they include: Lancashire, Kent, Scotland, Hertfordshire, Essex, and Suffolk. However, there's probably other locations I don't know about, plus, DNA can go back further than my tree. My LivingDNA results within Great Britain include the
following (also shown on map below):
My regions of Britain and Ireland from LivingDNA
  • South England 8%
  • East Anglia 6.6%
  • Northumbria 6.2%
  • Southeast England 3.8%
  • Central England 3.6%
  • South Central England 2.7%
  • Lincolnshire 2.7%
  • North Yorkshire 2.7%
  • Devon 1.5%
  • Northwest Scotland 1.5%
  • South Wales 1.5%

This is not representative of Lancashire, but it does cover my other known regions, and then some. Unfortunately, Lancashire is my most recent English branch (immigrated in the mid 1800s), so you'd think I'd have more of that than anything, whereas the other areas are from colonial times. Again, it's difficult to say how accurate this may be given that DNA can be more representative of about 1000 years ago, while my tree has only been researched as far back as about a few hundred years. Additionally, given the small percentages, it's entirely possible some of these are just attributed to noise (like a false positive).

What is very consistent with my family tree is that the only result in Ireland I get is actually a part of Northwest Scotland (Scots-Irish). Despite having a couple "Mc's" in my tree, they are all Scots-Irish, not Irish. Also, the total amount of 40.6% in Great Britain & Ireland is very consistent with my known ancestry. I estimate from what I can that my tree is approximately 35% British. Other reviews have been saying that LivingDNA tends to overestimate their total British results, so I was pleasantly surprised to see mine were fairly accurate.

What about the rest of Europe? Here's the results:
  • Europe (South) 30.2%
    • North Italy 17.3%
    • Tuscany 10.4%
    • Aegean 2.5%
  • Europe (North and West) 27.8%
    • Germanic 17.1%
    • Scandinavia 10.6%
  • Europe (East) 1.4% (on "Standard" setting, this is unassigned)
    • East Balkans 1.4%
My Europe South regions from LivingDNA

A total of 30.2% in Southern Europe is somewhat consistent with my tree (I had one Italian grandparent, so 25% on paper), but interestingly it's in almost exact agreement with most other companies. AncestryDNA says 31%, FamilyTreeDNA says 33%, and 23andMe says 29.5%. MyHeritage are the only outliers with 41.6% (which is one of the reasons I feel MyHeritage are the worst for ethnicity). However, looking at LivingDNA's breakdown for it, this is not really consistent with my tree. Most of my Italian branches have been researched back to the 1700s, and they are all from Southern Italy or Sicily, primarily three towns: Monteroduni, Sulmona, and Polizzi Generosa. LivingDNA has my results mainly in upper and mid Italy. You could possibly argue that Monteroduni and Sulmona are right on the boarder of the region they are calling "Tuscany" (the middle portion in pink on the map above/right), but certainly, Polizzi Generosa (Sicily) is not highlighted at all. Granted, the southern tip of Italy is highlighted as a part of the "Aegean" region, but I only get 2.5% in this category. Populations charts (example below) frequently show how North Italy and South Italy are genetically very different, so for my largest results in Italy to be in North Italy when my Italian ancestry is from Southern Italy just doesn't seem right. The entire Italian side of my family are dark haired, dark eyed, with olive toned skin. We are definitely Southern, and that is disappointingly not shown in LivingDNA's results.

Population chart from AncestryDNA - the closer the dots,
the more genetically similar (note the dots for Italy
show two groups, the larger one is northern Italy,
the smaller one is southern Italy,  showing
how genetically different they are)
Next we have a total of 27.8% in North & West Europe, with 17.1% Germanic and 10.6% Scandinavia. This could just be a coincidence, but if not, then a big congratulations is in order to LivingDNA, because they are pretty much the first company to accurately tell my British, Germanic, and Scandinavian DNA apart from one another. Every other company jumps from one extreme to another, or plays it safe by lumping a large portion of my DNA into a "broadly" Northwest European category, unable to break it down further (23andMe). According to my tree, I should be about 25% Germanic (Western Europe) and 12.5% Norwegian (Scandinavian). At other companies, Western Europe ranges from 0% to 17.9%, and Scandinavia ranges from 0% to 12.3%. While the upper ends of these ranges seem on par with LivingDNA, it is always at the expense of the other group (i.e., 12.3% in Scandinavia means 0% in Western Europe). If you're interested, you can see my complete results from all different companies here (although I did not include the sub-regions of Britain, there were too many). It's a shame Germany and Scandinavia can't be broken down further like Great Britain or even Italy are, but hopefully that will change in the future. I'll look forward to seeing how accurate it may be. I also note that LivingDNA was able to accurately tell Germany apart from France, something no other company has even attempted to do.

Lastly, we have the tiny 1.4% East Europe, which they're putting in more specifically in East Balkans (although the map coverage is the same for both). I have no known Eastern European or Balkans ancestry, but it's worth noting that in "Standard" mode, this 1.4% becomes "unassigned". So they are obviously unsure about this, and therefore it's likely just noise.

Similar to 23andMe, LivingDNA provides several levels of speculation or specification for your ethnicity results. There are three modes: Complete, Standard, and Cautious. Complete attempts to identify any "unassigned" DNA found in Standard mode. There was very little difference for me, which is why I used Complete mode here. As I mentioned, there was the 1.4% unassigned which got put in Europe East, and then there was 3% unassigned under Great Britain and Ireland which got put into the 1.5% Devon and 1.5% Northwest Scotland. Cautious mode groups regions more broadly (see below). Within each mode, there is an option to view results on a Global scale, Regional, or Sub-Regional. At Global, I'm 100% European on every mode. This is a little bit contrary to other companies, which often give me at least trace amounts of Middle East, North Africa, or South Asia. 

My results in Cautious mode
In Cautious mode, these are my Regional/Sub-regional results (also shown on map to the right):
  • Great Britain and Ireland 40.6%
    • Southeast England-related ancestry 18.2%
    • North Yorkshire-related ancestry 11.7%
    • East Anglia 6.6%
    • South Wales-related ancestry 1.2%
    • Great Britain and Ireland (unassigned) 3%
  • Northwestern Europe-related ancestry 27.8%
  • Pannonian Cluster-related ancestry 19.8%
  • South Italy-related ancestry 10.4%
  • Europe (unassigned) 1.4%

It's interesting to note that in Cautious mode, there is a 10.4% in "South Italy-related ancestry". It's not a very high amount, but it's interesting that it swapped from North Italy to South Italy for some reason. Meanwhile, my Scandinavian results have strangely disappeared completely. The map above is showing how some areas are found in more than one category. So the grayish blob over Germany is gray because it's in both "Northwestern Europe" and "Pannonian Cluster". Likewise, the brown parts of Britain are brown because they are in both "Great Britain & Ireland" and "Northwestern Europe". These results are more comparable with how other companies group their categories. That doesn't necessarily make it more accurate, just more broad.

My mtDNA haplogroup migration map from LivingDNA
As for the Y and mtDNA haplogroups, I am female so I have no Y haplogroup, and my mtDNA haplogroup is consistent with 23andMe and FTDNA's Full Sequence test: T2b. No revelations there. It includes a written history of the haplogroup, a coverage map, showing countries where your haplogroup is most commonly found, a migration map showing the route your haplogroup took out of Africa, and finally a Phylogenetic tree showing how your haplogroup descends from Mitochondrial Eve (or Y Chromosomal Adam). In comparison, 23andMe only offers the written history, the migration map, and the Phylogenetic tree, no coverage/frequency map. Also noteworthy, while 23andMe and LivingDNA include roughly the same amount of mtDNA raw data (23andMe includes 4,318 mtDNA SNPs, while LivingDNA includes more than 4,000), LivingDNA includes significantly more Y-DNA SNPs (roughly 20,000 to 23andMe's 3,733). Of course, neither of them include mtDNA or Y-DNA matches, so if that's what you're looking for, you'd have to take FTDNA's dedicated tests.

LivingDNA also provides a very detailed, interactive display of your results to share with others. Here's mine. While other companies often provide a similar way of sharing your results, none that I've seen have been quite this detailed or interactive. Does it share too much? LivingDNA also allows you to control what you share by giving you the option to remove elements or widgets.

I was hesitant to test with LivingDNA, given their lack of DNA matching, and the higher price tag, I felt like what you got wasn't worth that much money. Then it was on super sale over Christmas so I decided to take the plunge. I am pleased with the ethnicity report - at regional level, it's been the most accurate for me so far, but the sub-regional results need some work. Particularly if you already know your haplogroups, I wouldn't pay full price for this test, but I do think it's worth exploring, especially if they add DNA matches in the future.